LinkMap™
The LinkMap view presents a simplified view of measurement results by analyzing all the event table results for each pulse, whether using single or multiple pulse widths, and all test wavelengths. A span summary is displayed, in the form of a block diagram, for each test wavelength shown at the bottom of viewing window.
Tap each icon to obtain more information about that specific event on the fiber
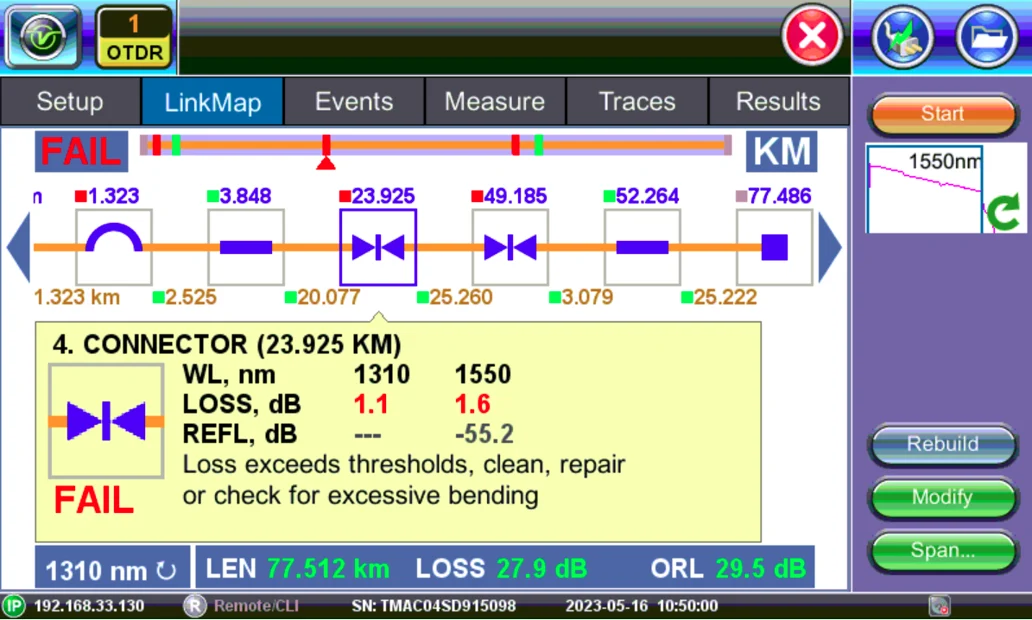
LinkMap showing connector with excessive loss
|
|
The link visibility can be significantly improved by using multiple pulse widths to provide better event details. |
LinkMap symbols
The table below summarizes the symbols used to represent various events on the fiber link.
| Icon | Description |
|
|
Span start (OTDR port) Indicates start of analysis section, as defined in setup. |
|
|
Fiber section |
|
|
End of Link/Span end Indicates start of analysis section), as defined in setup (distance or event index). |
|
|
Optical Connector/Physical contact (reflective event) |
|
|
Unknown Event - Distance Range or Dynamic Range inadequate to detect TRUE end. |
|
|
Blank Node |
|
|
Optical Connector - APC (Angled Polish) (reflective event) |
|
|
Splice (non-reflective event loss or gainer) |
|
|
Macrobend |
|
|
UPC connector |
| WDM Network | |
|
|
MUX-Generic |
|
|
MUX-DWDM |
| PON Network | |
|
|
Co-existence Filter |
|
|
Splitter - Balanced |
|
|
Splitter - Unbalanced/Asymmetric |
|
|
1xN Splitter (from OLT side) |
|
|
Tap - Generic with Drop |
|
|
Tap - Terminal (Terminated) |
|
|
End of Link (ONT detected; end user) |