Wifi Spectrum Analyzer
![]() The VeEX WiFi SA USB dongle is discontinued and no longer supported.
The VeEX WiFi SA USB dongle is discontinued and no longer supported.
WiFi SA was a portable spectrum analyzer on a USB dongle that displayed all RF activity in the WiFi bands (e.g., wireless networks, cordless phones, microwave ovens, Bluetooth devices, etc.).
For users who still have the dongle, the feature offers the following capabilities:
-
Helps determine the best available WLAN channels quickly for optimal performance
-
Helps to visualize and locate RF signals in the 2.4GHz and 5GHz spectrums
-
Discover and remedy competing access points
-
Optimize WLAN networks by locating and eliminating interference sources
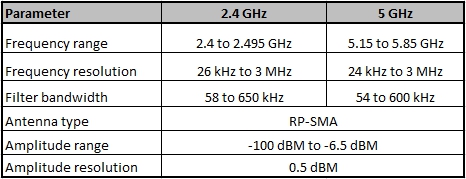
WiFi SA Specifications
-
Supports 802.11a/b/g/n networks
-
Supports both 2.4 GHz and 5 GHz bands
-
Equipped with RP-SMA antenna jack
-
Allows user to replace standard external Omnidirectional antenna with a higher gain or directional antenna as needed
-
-
The WiFi Analyzer is a compact and portable USB dongle that plugs into the USB 2.0 port of the V300 series
-
The WiFi SA test application menu is located in the Tools/Advanced Tools menu
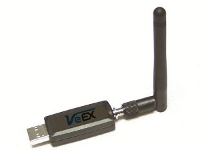
WiFi Analyzer USB dongle
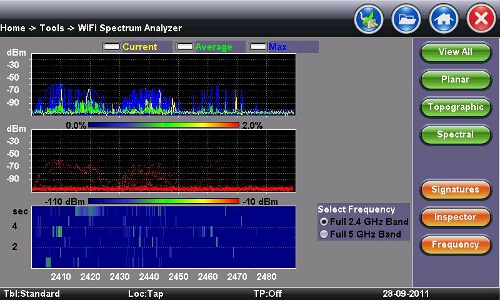
Display Summary
-
Planar view: Reports current, average, and maximum signal amplitude for each wireless frequency
-
Topographic view: Emphasizes which frequencies are the busiest across the entire spectrum
-
Spectral view: Historical view of wireless spectrum use at a point in time
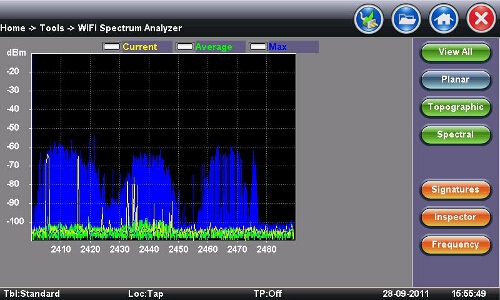
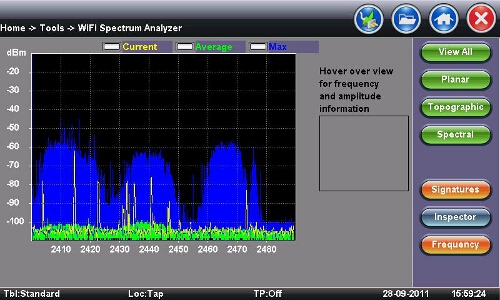
WiFi SA - Planar View
Planar View
-
Traditional Spectrum Analyzer view with Max, Average, and Current results
-
Displays RF activity in real time and tracks average and max values over a given period
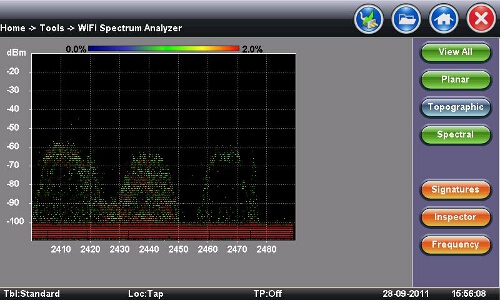
WiFi SA - Topographic View
Topographic View
-
Similar to a density map - plots frequency versus amplitude
-
Uses a special color scheme to assign colors to frequency amplitude points and to identify how often a particular coordinate is recorded
-
Great resource for identifying devices with very low duty cycles
-
Leaving it running will give a good indication of the typical local network conditions
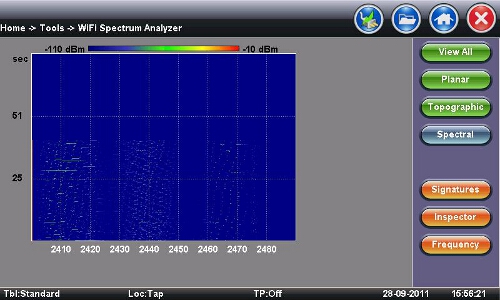
WiFi SA - Spectral View
Spectral View
-
Waterfall type view across the whole band - graphs amplitude levels over time
-
Uses color to pick out the relative signal strength at each point in time
-
Great tool for troubleshooting intermittent problems, since it highlights devices that are perhaps emitting only short bursts of noise
-
For example - discover microwave oven in the kitchen interfering with WLAN
-
WiFi SA - Signatures
Signatures
-
The Signatures button presets are available to identify unknown sources of RF activity (e.g., microwave oven)
-
Select a device in the sidebar and click the pattern in the Topographic view to identify a device
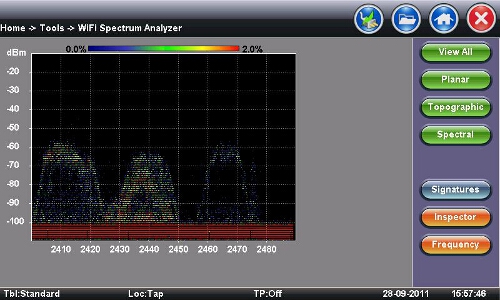
WiFi SA - Inspector
Inspector
-
The Inspector button setup allows the user to measure the frequency of the RF activity or interference of interest
-
When selected, a prompt and result box appears
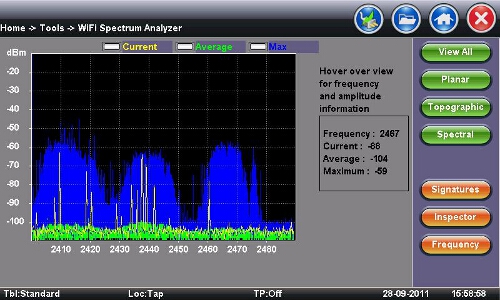
WiFi SA - Inspector - Result
Inspector Button - Result
-
Current, Average, and Maximum amplitude values provide an indication of level fluctuation over measurement period
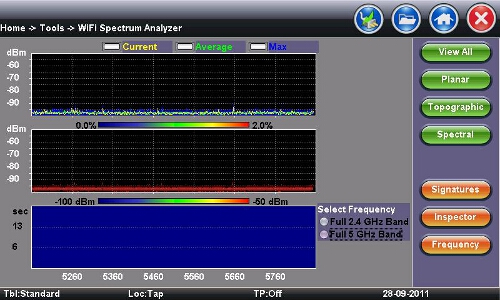
WiFi SA - Frequency
Frequency
-
This button allows the user to select frequency band for testing