Wi-Fi Spectrum Analyzer
![]() The VeEX Wi-Fi SA USB dongle is discontinued and no longer supported.
The VeEX Wi-Fi SA USB dongle is discontinued and no longer supported.
Wi-Fi SA was a portable spectrum analyzer on a USB dongle that displayed all RF activity in the Wi-Fi bands (e.g., wireless networks, cordless phones, microwave ovens, Bluetooth devices, etc.).
For users who still have the dongle, the feature offers the following capabilities:
-
Helps determine the best available WLAN channels quickly for optimal performance
-
Helps to visualize and locate RF signals in the 2.4GHz and 5GHz spectrums
-
Discover and remedy competing access points
-
Optimize WLAN networks by locating and eliminating interference sources
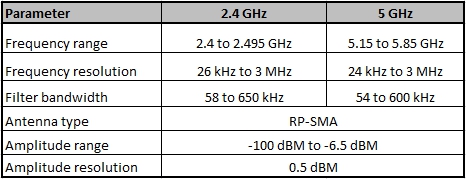
Wi-Fi SA Specifications
-
Supports 802.11a/b/g/n networks
-
Supports both 2.4 GHz and 5 GHz bands
-
Equipped with RP-SMA antenna jack
-
Allows user to replace standard external Omnidirectional antenna with a higher gain or directional antenna as needed
-
-
The Wi-Fi Analyzer is a compact and portable USB dongle that plugs into the USB 2.0 port of the V300 series
-
The Wi-Fi SA test application menu is located in the Tools/Advanced Tools menu
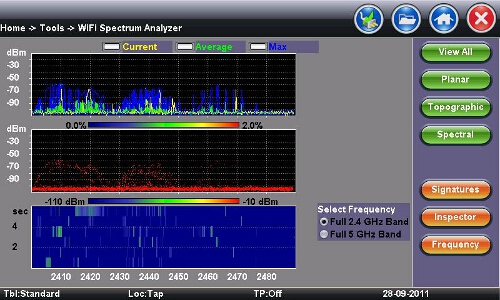
Wi-Fi SA Display Summary
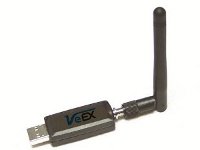
Wi-Fi Analyzer USB dongle
Display Summary
-
Planar view: Reports current, average, and maximum signal amplitude for each wireless frequency
-
Topographic view: Emphasizes which frequencies are the busiest across the entire spectrum
-
Spectral view: Historical view of wireless spectrum use at a point in time
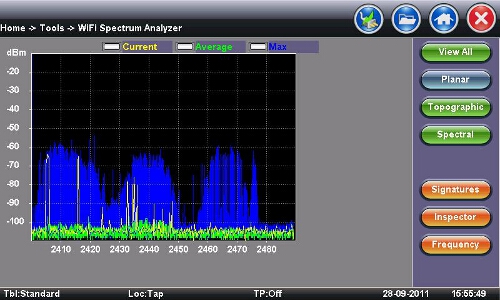
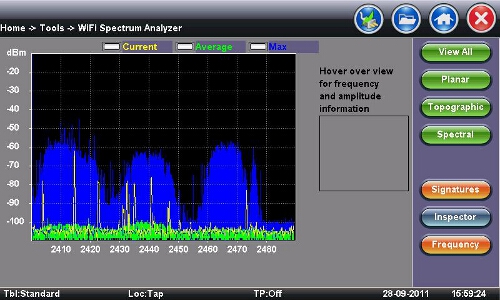
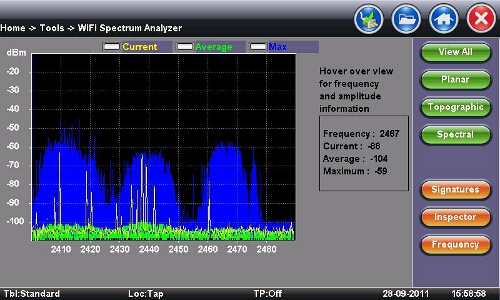
Wi-Fi SA - Planar View
Planar View
-
Traditional Spectrum Analyzer view with Max, Average, and Current results
-
Displays RF activity in real time and tracks average and max values over a given period
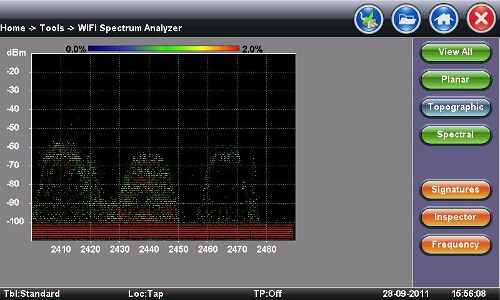
Wi-Fi SA - Topographic View
Topographic View
-
Similar to a density map - plots frequency versus amplitude
-
Uses a special color scheme to assign colors to frequency amplitude points and to identify how often a particular coordinate is recorded
-
Great resource for identifying devices with very low duty cycles
-
Leaving it running will give a good indication of the typical local network conditions
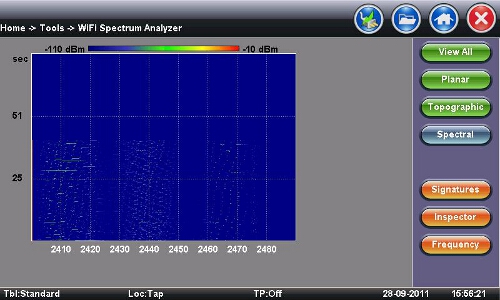
Wi-Fi SA - Spectral View
Spectral View
-
Waterfall type view across the whole band - graphs amplitude levels over time
-
Uses color to pick out the relative signal strength at each point in time
-
Great tool for troubleshooting intermittent problems, since it highlights devices that are perhaps emitting only short bursts of noise
-
For example - discover microwave oven in the kitchen interfering with WLAN
-
Wi-Fi SA - Signatures
Signatures
-
The Signatures button presets are available to identify unknown sources of RF activity (e.g., microwave oven)
-
Select a device in the sidebar and click the pattern in the Topographic view to identify a device
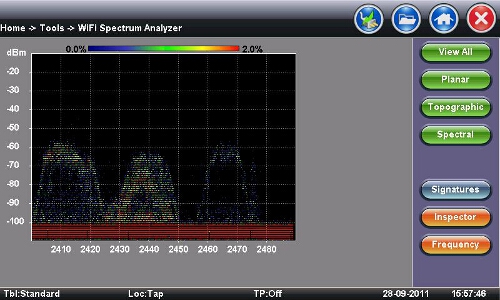
Wi-Fi SA - Inspector
Inspector
-
The Inspector button setup allows the user to measure the frequency of the RF activity or interference of interest
-
When selected, a prompt and result box appears
Wi-Fi SA - Inspector - Result
Inspector Button - Result
-
Identifies frequency and amplitude
-
Current, Average, and Maximum amplitude values provide an indication of level fluctuation over measurement period
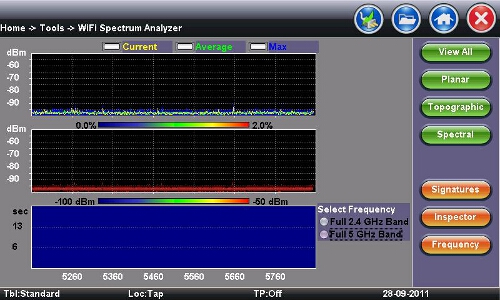
Wi-Fi SA - Frequency
Frequency
-
This button allows the user to select frequency band for testing