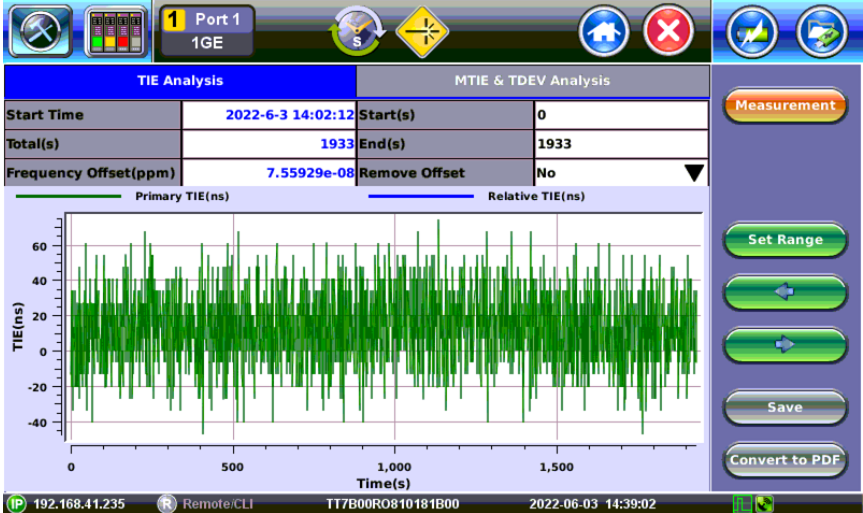
TIE Analysis
By default, this screen shows a complete view of all the TIE or TE data captured, so users can visually identify short-term, long-term stability issues, frequency offset (ramp) and other characteristics.
TIE Analysis
-
Start Time: in YYYY-MM-DD hh:mm:ss format
-
Total (s): Total measurement time, in seconds
-
Frequency Offset (ppm): Frequency error calculated from all the samples and presented in parts-per-million. When the frequency of the recovered clock is accurate (compared to the reference clock), the graph has a flat horizontal trend.
-
Start (s): Marks the beginning of the data presented on the graph. Users can change this value, to focus (zoom in) on specific areas of the sampled data, by entering the desired number (in seconds) on this field and pressing the Set Range button.
-
End (s): Marks the end of the data presented on the graph. Users can change this value, to focus (zoom in) on specific areas of the sampled data, by entering the desired number (in seconds) on this field and pressing the Set Range button.
-
Remove Offset: No, Yes. Users may select to mathematically remove the effects of constant frequency offset from the data, to obtain Relative TIE.
-
Marker: Tapping on the graph brings up the red crosshair markers. Users can tap on different areas of the graph to bring up specific datapoints. Use the < and > buttons to fine-tuning the marker position, sample by sample.