PDV Analysis
Packet Network elements between Master and Slave causes non-linear impairments due to congestions, processing delay, queuing mechanisms in network switches and routers. This is defined as Network PDV (Packet Delay Variation) or packet jitter. PDV is a property of the network that can lead to Frequency wander and Phase inaccuracy on the slave since the slave uses the timing packet to recover Frequency and Phase.
PDV Metrics include: Sync and Follow up PDV, Slave Wander, and Delay Request PDV. This function provides MTIE and TDEV analysis as well as FPP, FPC and FPR measurements as defined in ITU-T G.8261.1 standard.
Tap on the PDV Analysis button on the home menu to access this feature.
PDV Setup
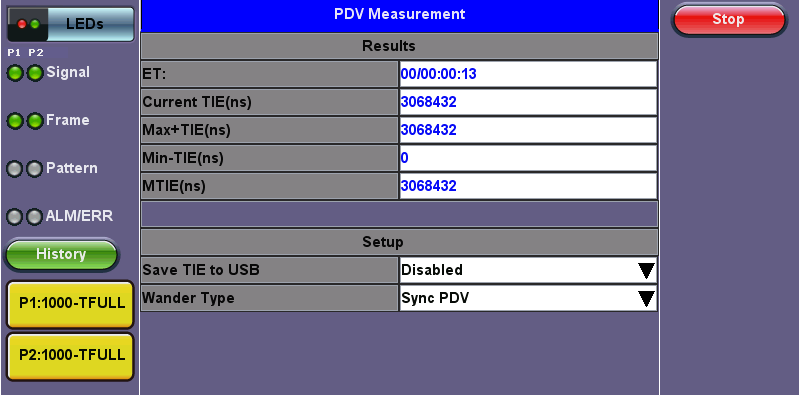
Setup
Save TIE to USB can be turned ON to write all wander measurements to a FAT32 USB Memory stick in real time, to be analyzed later on.
Select Wander Type from the drop down menu:
-
Sync PDV: Monitors TIE of Sync Messages
-
Follow Up PDV: Monitors TIE of Follow_Up Messages
-
Slave Wander: Monitors Slave TIE based on Delay_Request Messages (Note that t3 delay_request timestamp is not always present in the messages originating from the slave).
-
Delay Req PDV: Monitors TIE of Delay_Request messages based on Delay_Response (t4) timestamps.
Tap on the Start button to initiate the measurements and data logging and Stop to end recording.
After stopping the test, if the built-in MTIE/TDEV option (license) is enabled, tap on Analysis to view the TIE graph and perform the MTIE/TDEV analysis on the recorded TIE data. Alternatively, tap on PDV Analysis to view the PDV graph and perform MTIE/TDEV Analysis.
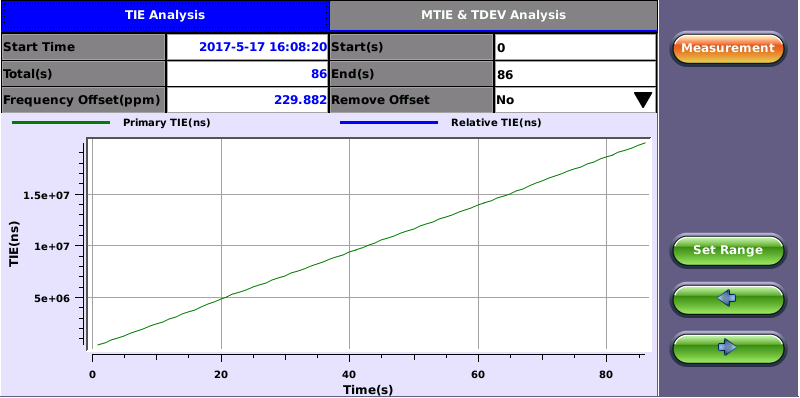
TIE Analysis
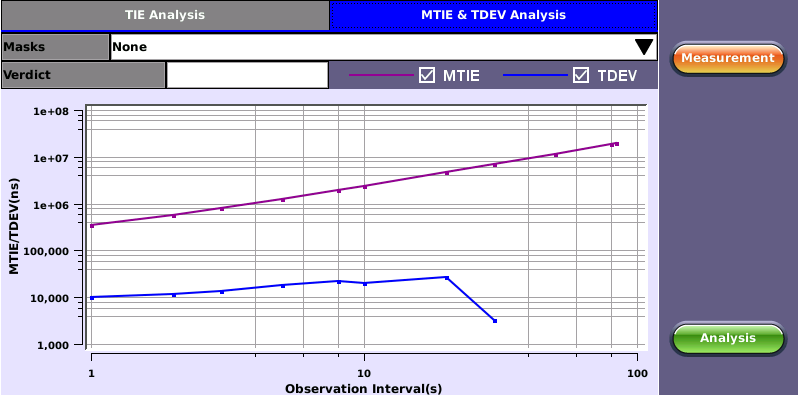
MTIE & TDEV Analysis
Built-in MTIE & TDEV Analysis (Optional License)
For more information on MTIE & TDEV Analysis refer to Built-in MTIE & TDEV Analysis (Optional License) section in the Jitter and Wander application.
PDV Analysis Delay
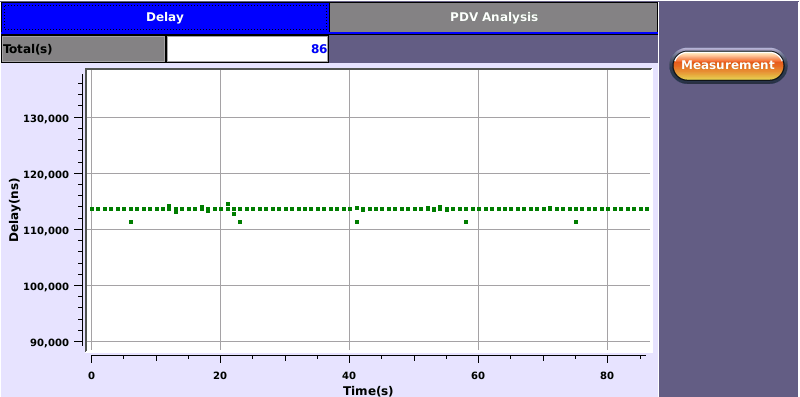
PDV Analysis - Delay
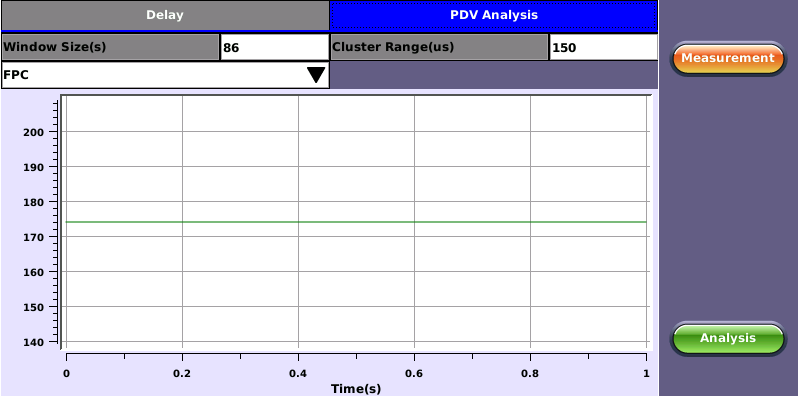
Tap on PDV Analysis to view the PDV graph and perform Delay/PDV Analysis per ITU-T G.8261.1 standard.
The objective of this category of PDV metrics is to study the population of timing packets within a certain fixed cluster range starting at the observed floor delay. The population of timing packets can then be compared with acceptance or rejection thresholds. The main idea here is to ensure that at least a minimum number of packets, or alternately a minimum percentage of packets, always remains within the specified fixed cluster range starting at the observed floor delay.
PDV Analysis
Definitions:
x[i] = measured latency of packet I
N = number of packets in measurement data set
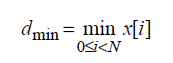
Minimum Observed delay = dmin
Indicator function for floor packet selection:
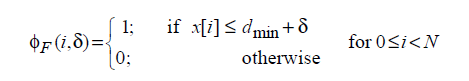
δ = cluster range
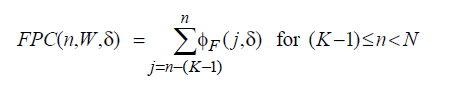
W = Window interval
K = W/τP = number of packets transmitted in the window interval
Floor Packet Count (FPC) with Sliding window
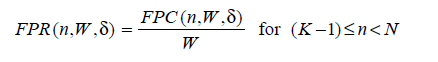
Floor Packet Rate (FPR) with Sliding window
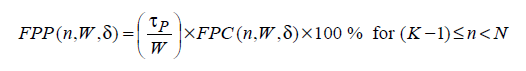
Floor Packet Percent (FPP) with Sliding window
ITU-T G.8261.1 Network Limits:
-
With window interval W = 200s and fixed cluster range δ = 150μs starting at the floor delay, the network transfer characteristic quantifying the proportion of delivered packets that meet the delay criterion should satisfy:
FPP (n, W, δ) ≥ 1%
-
That is, the floor packet percentage must exceed 1%.
-
This means that for any window interval of 200 seconds at least 1% of transmitted timing packets will be received within a fixed cluster, starting at the observed floor delay, and having a range of 150 μs.