Built-in MTIE & TDEV Analysis (Optional)
SyncE Wander Measurements with Analysis
![]() Wander Analysis and MTIE / TDEV Post Analysis are optional features.
Wander Analysis and MTIE / TDEV Post Analysis are optional features.
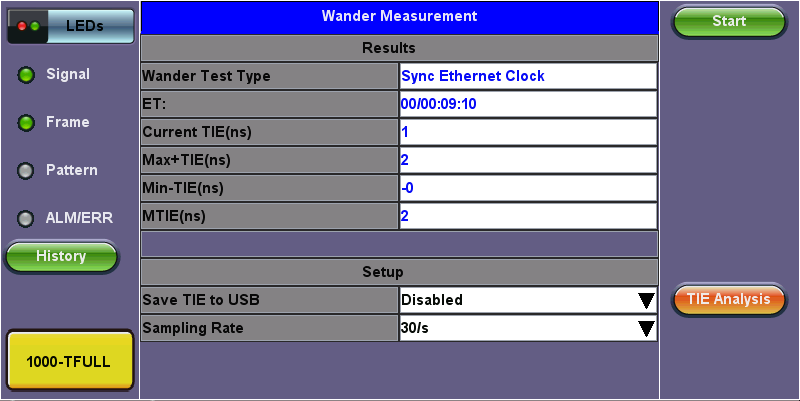
This option enables the test set to analyze up to 72 hours’ worth of wander measurement data and compare it against standard masks for a PASS/FAIL assessment, without the need for a PC. The test set may allow the analysis to be performed while the test is still running for run-time verification. Longer test take a lot longer to be analyzed, so the VeEX Wander Analysis PC Software is recommended for tests longer than 24 hours. Tap on TIE to view TIE, MTIE and TDEV Analysis.
Features:
- Provides further post-processing of clock stability data, such as MTIE and TDEV
- Frequency offset calculation and removal for relative TIE analysis
- Standard MTIE and TDEV masks can be selected
- MTIE and TDEV results and mask export to CSV for further report generation using spreadsheets
- Direct PDF report generation to USB
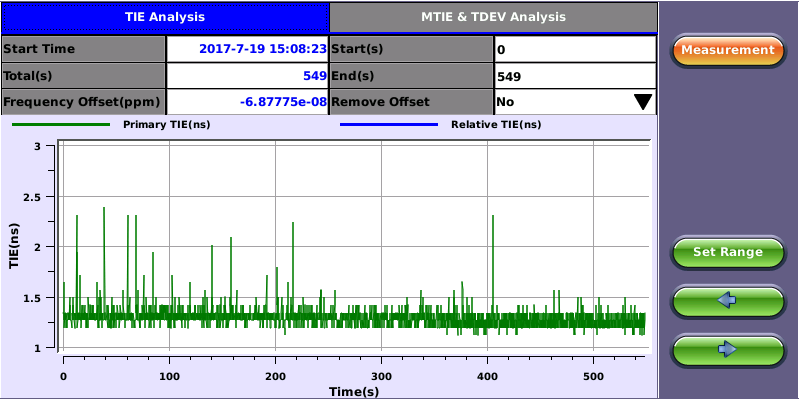
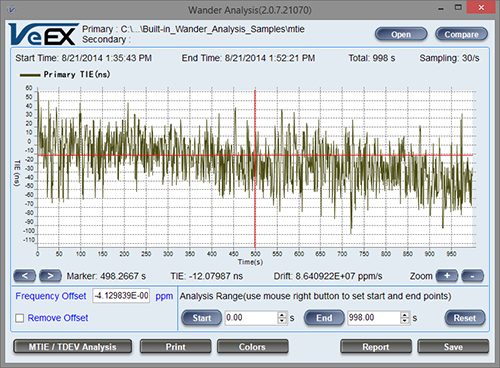
TIE Results
TIE Results
- Date and Time stamp indicating when the test was started
- Total of seconds recorded during the test
- Beginning and end of the data set to be analyzed and displayed in the graph (5) below. Tap in the Start and/or End field and enter the desired time limits, then press the Set Range button to apply these changes.
- Based on all the TIE measurements captured, the test set automatically calculates any small difference in frequency between the signal under test and the reference clock. Once the frequency difference is known, remove it to perform Relative TIE measurements. The offset removal tool is important for field tests when the local reference clock used is highly accurate and stable but not traceable to the PRC in the network core (e.g. a portable frequency reference). Even if the frequency of the local reference is a few ppb (parts per billion) different than the PRC, it can still be used for wander measurements, as long as it is highly stable, because the Offset Removal feature can mathematically remove the know difference and make it as if a traceable reference had been used. Once removed, perform a relative MTIE (or MRTIE) and TDEV analysis.
- Auto-scale TIE graph, based on the limits set.
- Press the Measurement button to return to the current wander measurements
- Fine cursor controls. Use the stylus to tap on the screen to position the cursor and then use these arrow buttons to position the cursor and read specific TIE values. The rubber cursor keys can also be used to move the cursor.
![]() Save and Convert to PDF options may not be available on all software versions.
Save and Convert to PDF options may not be available on all software versions.
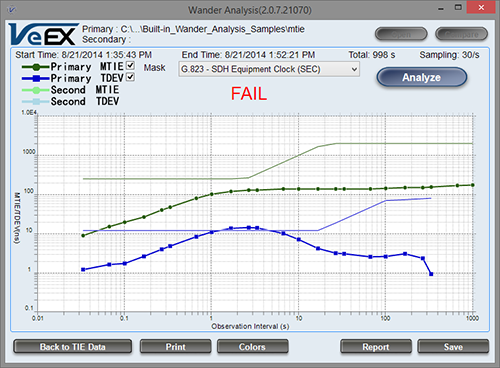
MTIE & TDEV Pass/Fail Analysis
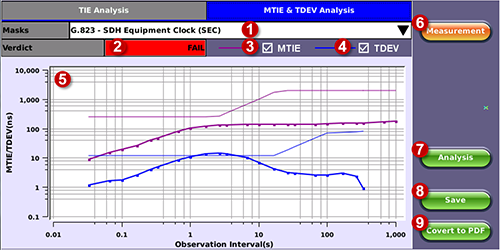
MTIE Results
- Standard MTIE & TDEV masks selection
- Pass or Fail indicator, evaluated depending on selected masks
- MTIE line color indicator and Enable/Disable check box
- TDEV line color indicator and Enable/Disable check box
- MTIE & TDEV logarithmic graphs and standard masks
- Press this button to return to the wander measurements screen
- Once the mask has been selected, press Analysis to run the MTIE and/or TDEV calculations. Depending on the number of samples collected, this calculation could take a few minutes.
- Save the MTIE, TDEV and mask calculations in CSV format to a USB Memory stick. The graph can be recreated using a spreadsheet program like Microsoft® Excel, printed as a report or shared via email or any other electronic media
- Generates a MTIE and TDEV report in PDF format to a USB Memory stick.
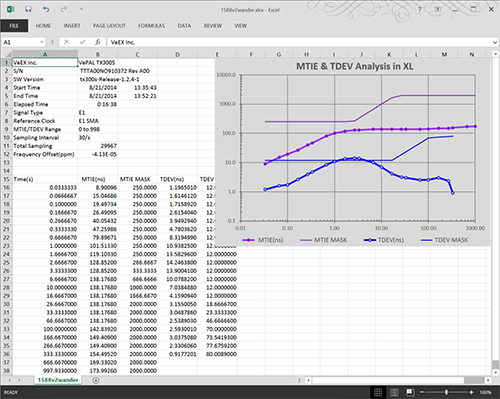
MTIE & TDEV Results Exported to CSV
VeEX MTIE/TDEV Wander Analysis PC Software
- Provides further post-processing of clock stability data, such as MTIE and TDEV for long-term tests
- Frequency offset calculation and removal for relative TIE analysis
- Standard and user-programmable masks
- PDF report generation
- Conversion of TIE data file, fro VeEX’s proprietary format to an open CSV format
- Fully resizable window, to accommodate any screen size and provide detailed zoom levels
- Compact stand-alone Windows® software. It can be carried in the same USB memory as the TIE data. No installation is necessary.
- For added convenience, the software doesn’t need installation and can be stored on and run from the same USB stick where the wander log files are being stored.
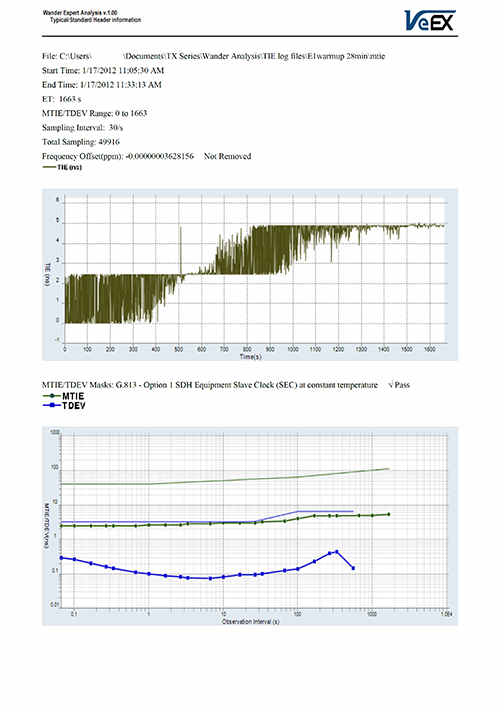
The VeEX Wander Analysis PC software can be downloaded from the VeEX Inc.website from the product page.
TIE Measurement Results
Click Open to load the desired MTIE of Phase file and see the TIE behavior on the screen. Use the Compare button to load a secondary trace for comparison purposes. Up to two traces can be displayed and analyzed simultaneously.
Click MTIE/TDEV Analysis to go to the wander analysis function.
MTIE & TDEV Analysis
Select the desired tolerance masks from the pull-down list, then click Analyze to perform the MTIE and/or TDEV analysis.
MTIE & TDEV Analysis Report in PDF
Click Report to generate a copy of the measurement and analysis in PDF format.