Results
Summary
- Line Rate:
Indicates the transmitted and received bit rate
- 1.0625 Gbps, 2.125 Gbps, 4.25 Gbps, 8.50Gbps, or 10.52 Gbps, 14.025G, 16G displayed in Mbps
- Framed Rate: Total number of frames including overhead of any type per second (Mbytes)
- Data rate: Total count of frames with payload data per second (Mbytes)
- Utilization: Bandwidth utilization in %
- # of Bytes: Number of bytes transmitted versus bytes received.
- BB Credits Used: Number of Buffer Credits used.
Summary (Throughput only)
- Total Frames: Total number of frames transmitted versus frames received
- Bad Frames: Number of frames transmitted but not received.
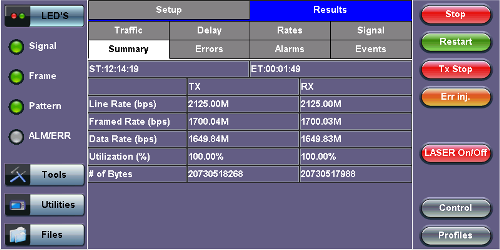
FC - BERT - Summary
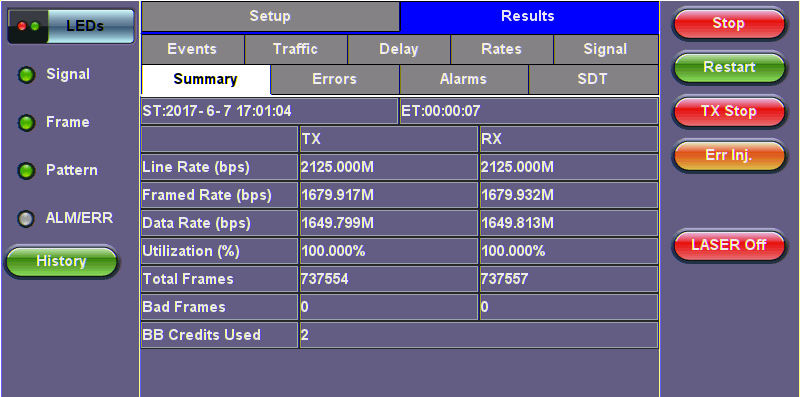
FC - Throughput - Summary
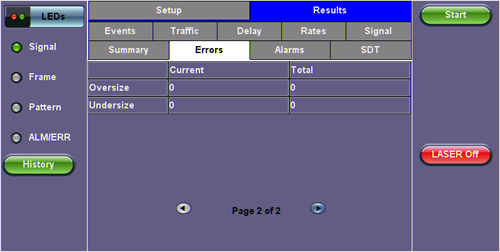
Errors
Current and Total values for:
- Bits: Number of bits received
- BER: Bit error ratio based on PRBS received or ratio of payload bit errors to total received payload bits
- Symbol: Symbol error or Code Violation is a bit error or disparity error occurring in a primitive sequence or Ordered Set
- FCS/CRC: Number of frames with either a bad or missing CRC or Frame Check Sequence
- Oversize: Number of Oversize frames received (> 2112 bytes)
- Undersize: Number of Undersize frames received (< 28 bytes)
Errors (Throughput only)
- Frame Loss: Number of frames lost
- Frame Loss (%): Percentage of frames lost
- OOS: Number of out-of-sequence frames received
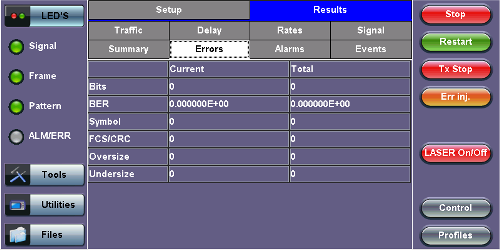
BERT - Errors
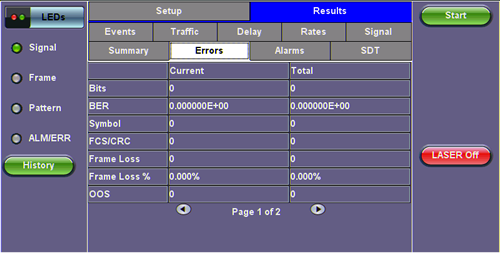
Throughput - Errors (Page 1)
Throughput - Errors (Page 2)
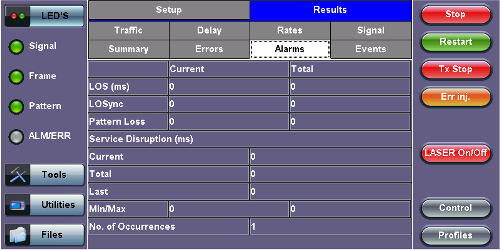
Alarms
Current and Total values for:
- LOS:Number of times the Link has transitioned to a Loss of Signal state in the measurement interval. Generally loss of optical signal.
- LOSync: Number of times the Link has transitioned to a Loss of Sync state in the measurement period
- Pattern Loss: Number of times test pattern or test sequence was lost
- Service Disruption
- Current: Current disruption in ms
- Total: Total measurement period
- Last: Last disruption measurement time
- Min/Max: Minimum and Maximum disruption time
- No. of Occurrences: A count of the disruption events over the measurement period
FC-BERT/FC-Throughput - Alarms
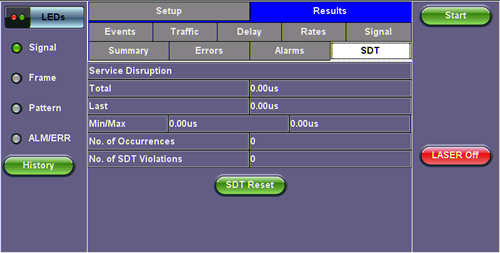
Service Disruption Test (SDT) (Throughput only)
- Total: Total cumulative service disruption for the duration of the test.
- Last: Last SDT measured during the test.
- Min/Max: Minimum and maximum SDT measured during the test.
- No. of Occurrences: Number of service disruption events (SDTs).
- No. of SDT Violations: Number of instances the SDT threshold was met or exceeded.
FC-Throughput Results - SDT
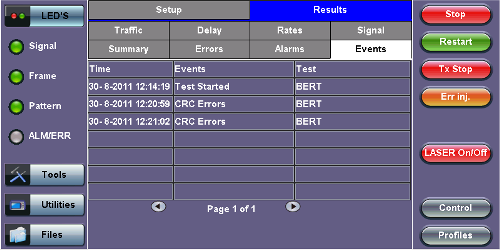
Events
Time stamped event table:
- Time: Indicates when the test was started, an anomaly occurred or a test was stopped
- Event/Event Type: Indicates type of anomaly
- # of Events: Indicates the number of times the event occurred
- Test: Indicates the test mode

Throughput - Events
BERT - Events
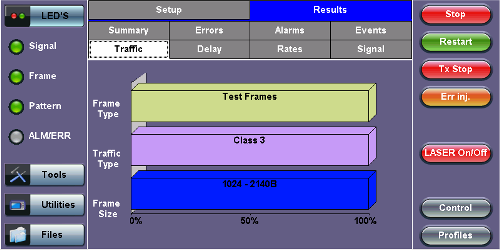
Traffic Distribution Overview
Graphical representation of:
- Frame type: Test frames in BER mode
- Traffic type: Class of service set by the SOF delimiter
- Frame size:
- FC-1 mode - the frame size is determined by the test sequence being used
- FC-2 mode - the frame size corresponds to the frame size configured in the traffic menu
FC-BERT/FC-Throughput - Traffic Summary
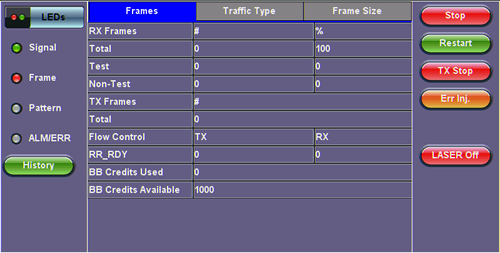
Traffic Distribution Details - Frames
- RX (Received) Frames
- Total: Total number of frames received
- Test: Number of test frames received
- Non-Test: Number of non-test frames received
- TX (Transmitted) Frames
- Total: Number of test frames transmitted
- Flow Control: Flow control is the FC-2 control process to pace the flow of frames between Nx_Ports, an Nx_Port and the Fabric and within the Fabric to prevent overrun at the receiver.
- Flow control is managed between Nx_Ports (end-to-end) and between FC_Ports (buffer-to-buffer). Flow control management has variations dependent upon the service class, however Class 3 uses only buffer-to-buffer flow control.
- RR-RDY: For Class 3 frames transmitted and received, a R_RDY is issued when a receive buffer is available.
Memory or “buffers” to temporarily store frames as they arrive and until they are assembled in sequence, and delivered to the upper layer protocol. Buffer Credits are the number of frames a port can store. To track the number of frames transmitted for which R_RDY responses are outstanding, the transmitting FC_Port uses the BB_Credit_CNT.
- BB Credits Used: The number of unacknowledged or outstanding frames awaiting R_RDY responses from the directly attached FC_Port.
- BB Credits Available: The number of frames transmitted and received R_RDY responses from the directly attached FC_Port.
FC-BERT/FC-Throughput - Frame Distribution
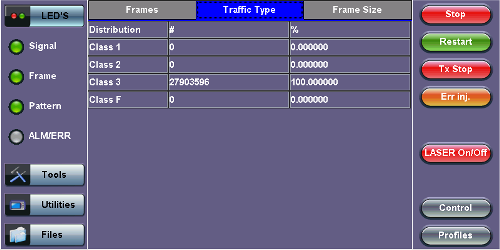
Traffic Distribution - Traffic Type
Fibre Channel supports three classes of services, and a fourth which is a combination of classes 1 and 2.
Similar to ATM, different classes allow Fibre Channel to support a variety of communication needs.
- Class 1: Provides a circuit-emulation service for time-sensitive applications such as video teleconferencing.
- Designed for dedicated, non-bursty links between supercomputers. Class 1 traffic is circuit-switched.
- Class 2:
Provides guaranteed delivery for connectionless traffic.
- Class 2 traffic is switched on each frame rather than on a connection. An acknowledgment from the destination provides an end-to-end guarantee of delivery.
- Class 3: Offers a best-effort connectionless service.
- Class 3 is similar to Class 2, except that no guarantee is given for delivery.
FC-BERT/FC-Throughput - Traffic Type Distribution
Frame Size Distribution
Indicates the number and percentage of different frame sizes received during the test period.
FC-BERT/FC-Throughput - Frame Size Distribution
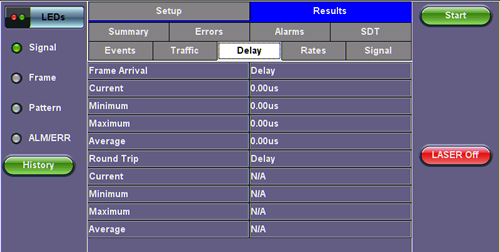
Delay
Frame Arrival Delay or Latency is the round-trip delay experienced by a frame as it traverses the fiber link or network. The difference between the transmitted time and received time is the measured delay.
Indicates the Current, Minimum, Maximum, and Average frame arrival delay during the test period.
Delay (Throughput only)
Current, Minimum, Maximum, and Average Round-Trip Delay during the test period is also displayed.
FC - Throughput - Delay
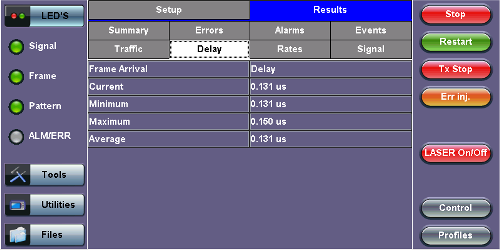
FC - BERT - Delay
Frame Rate Summary
Graphical representation of the Frame rates and Data rates.

FC-BERT/FC-Throughput - Frame Rate Summary
Frame Rate Details
Tabular representation of the Transmitted and Received frames and the corresponding Data Rates in Mbps.
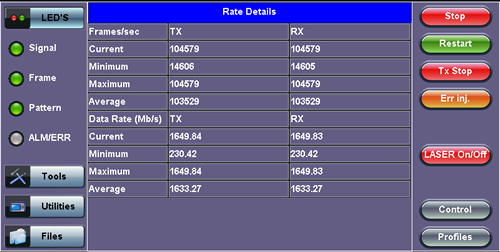
FC-BERT/FC-Throughput - Frame Rate Details
Signal
Level (Page 1)
The Signal tab displays the Level and Frequency screen. Page 1 displays the level measurement Loss of Signal (LOS), and the Saturation level for optical signals is shown graphically, including the level measurement in dBm.
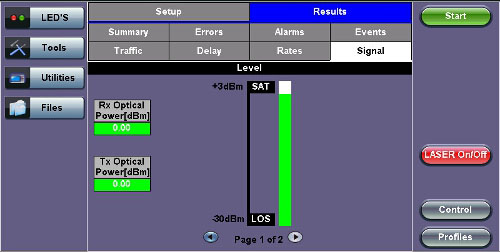
FC-BERT/FC-Throughput Signal - Level (Page 1)
Optical Information (Page 2)
Page 2 displays the Optical module XFP information which includes Vendor name, Part number, and Optical Wavelength.
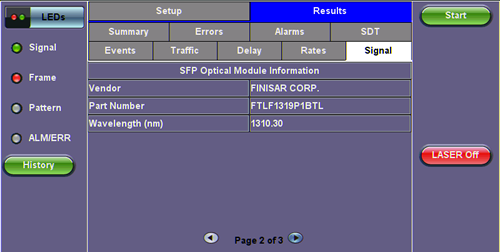
FC-BERT/FC-Throughput Signal - Optical Information (Page 2)
Frequency (Page 3)
Page 3 displays the Frequency information which includes:
- Current [bps]: Indicates current frequency level.
- Offset [ppm]: Indicates the frequency offset.
- Min [ppm]: Indicates the minimum frequency detected.
- Max [ppm]: Indicates the maximum frequency detected.