Wi-Fi Heatmap
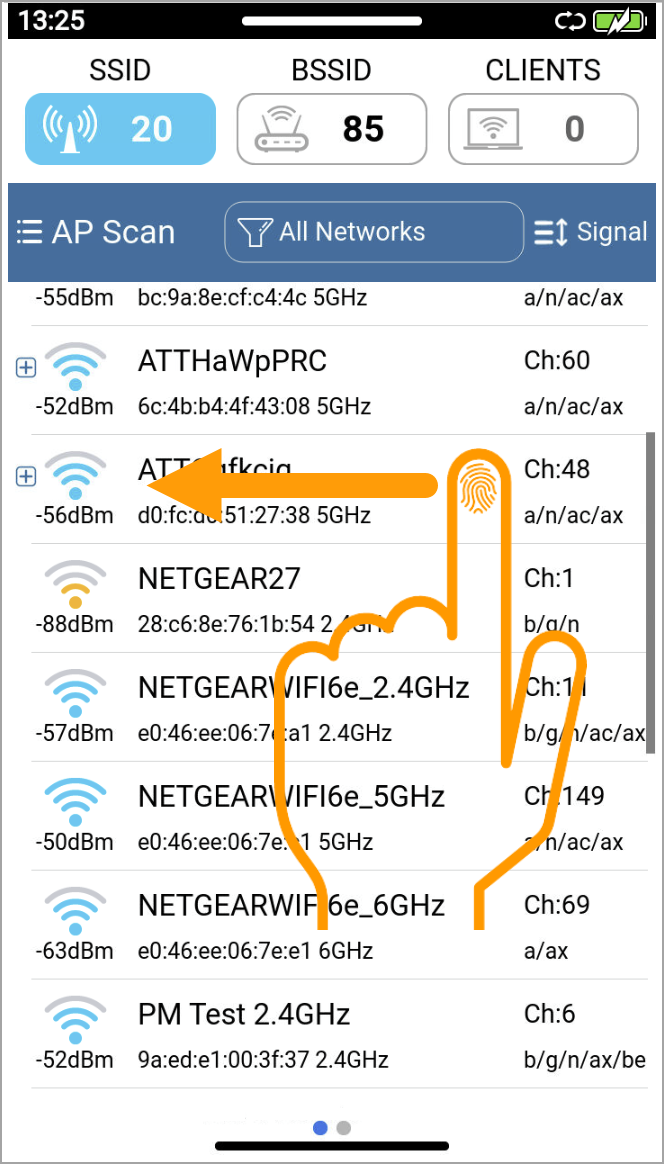
Select the Heatmap button, then swipe left on the AP Scan screen to access the configuration screen for the Passive Wi-Fi Heatmap menu.
The Wi-Fi Heatmap shows a map of the signal strength across the entire space. It visualizes signal coverage across a site without connecting to the network. First, load a floor plan, then walk the area. The unit automatically maps the strongest access point signal at each location in real time. Results are displayed on a single map, identifying weak coverage zones and verifying overall Wi-Fi performance.
The test set scans without connecting to any network. Thus, it can run on any environment and captures what every client device in that space would experience, not just what one connected device sees.
Configuration
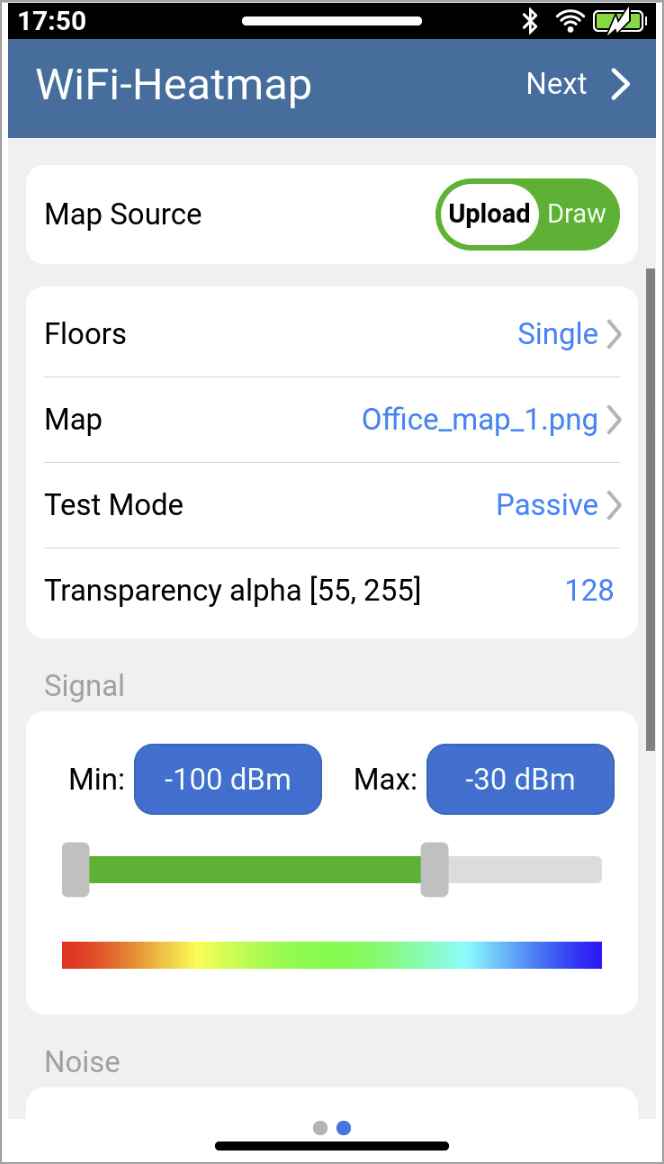
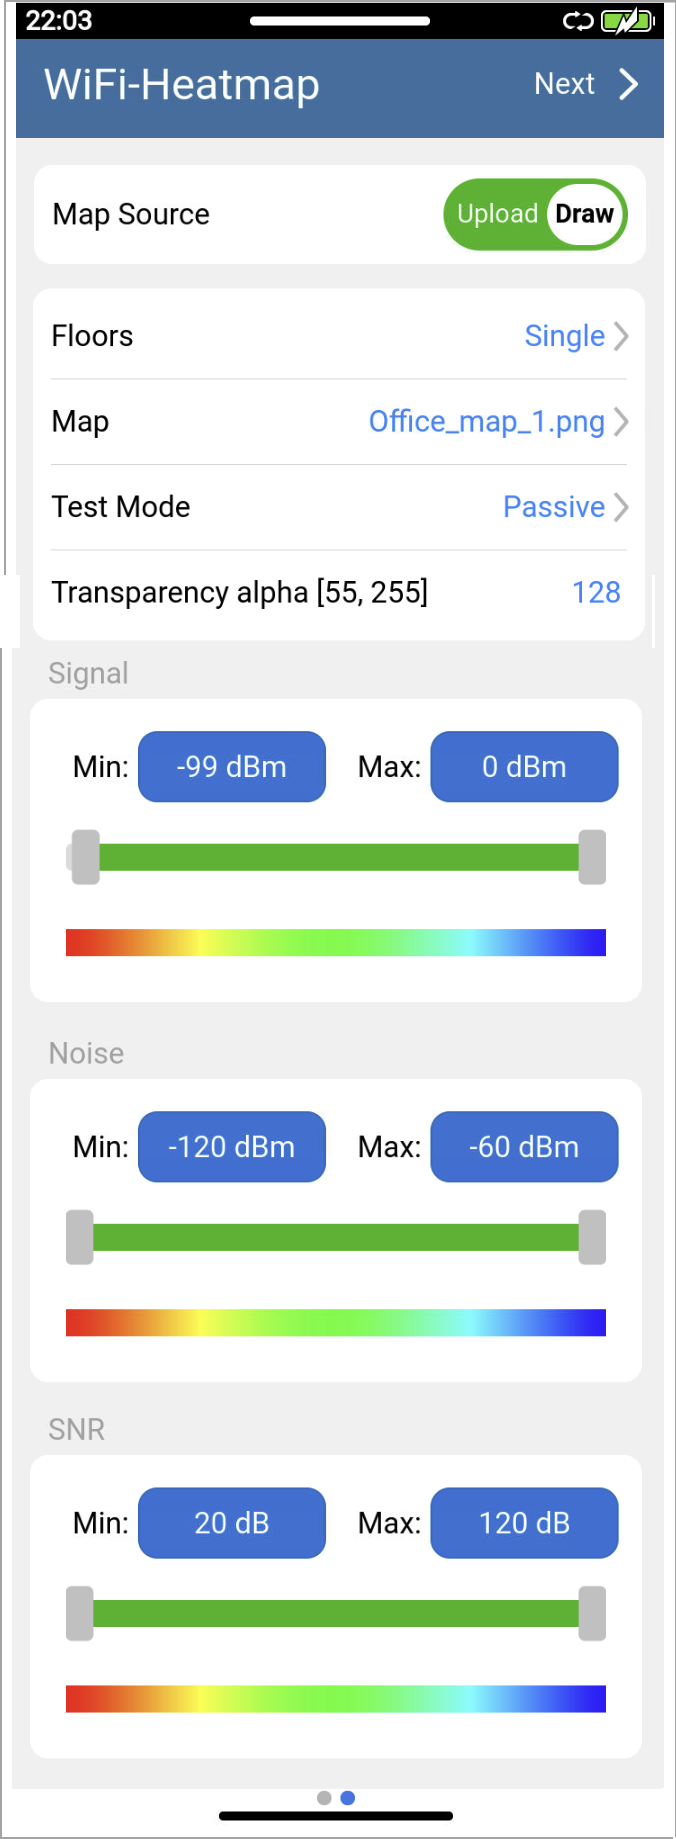
Map Source
Maps can be uploaded from a USB stick, uploaded through Web Remote, or drawn on the test set using tools provided on the interface.
Select the Map option to choose a previosly uploaded map. To upload a map from a USB stick, select the  Upload icon and choose the map file to upload. Supported file formats are .jpg and .png.
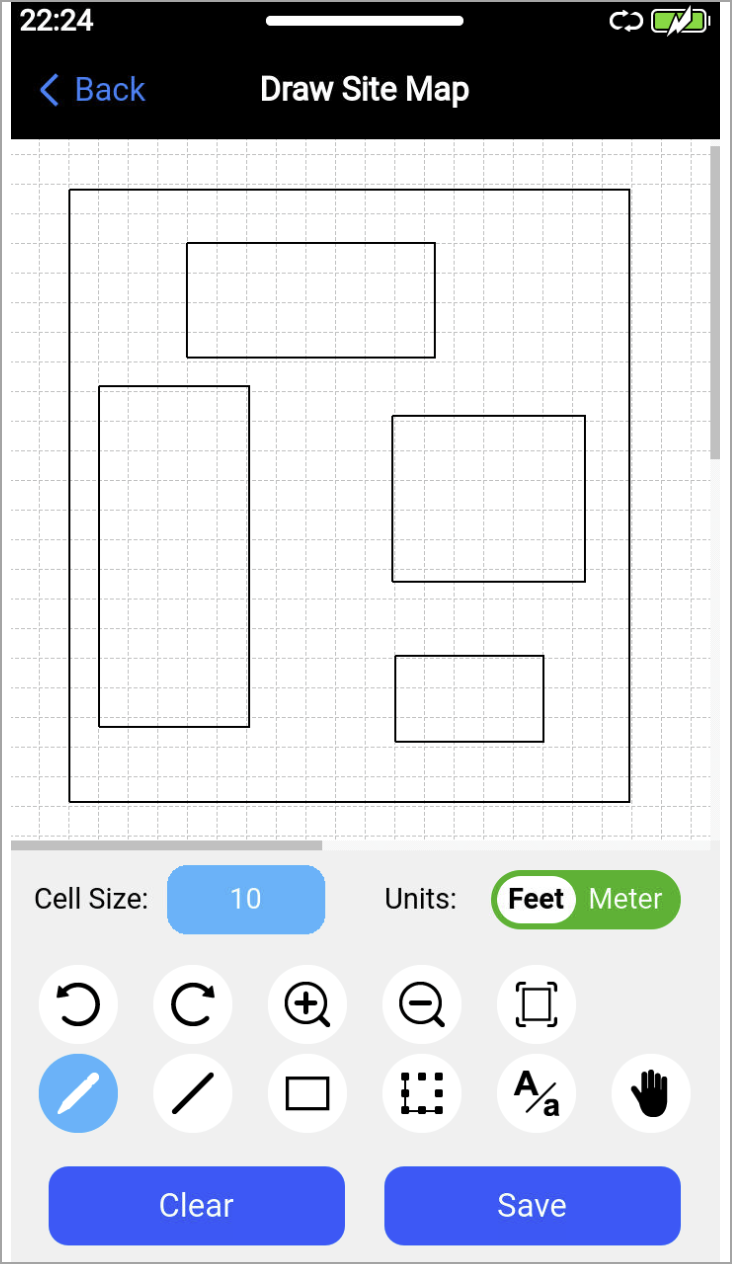
Draw Site Map
Select Draw to show the Draw Site Map screen. Use the tool icons at the bottom to draw the map, then select Save. Select Close to return to the Configuration screen.
Floors
-
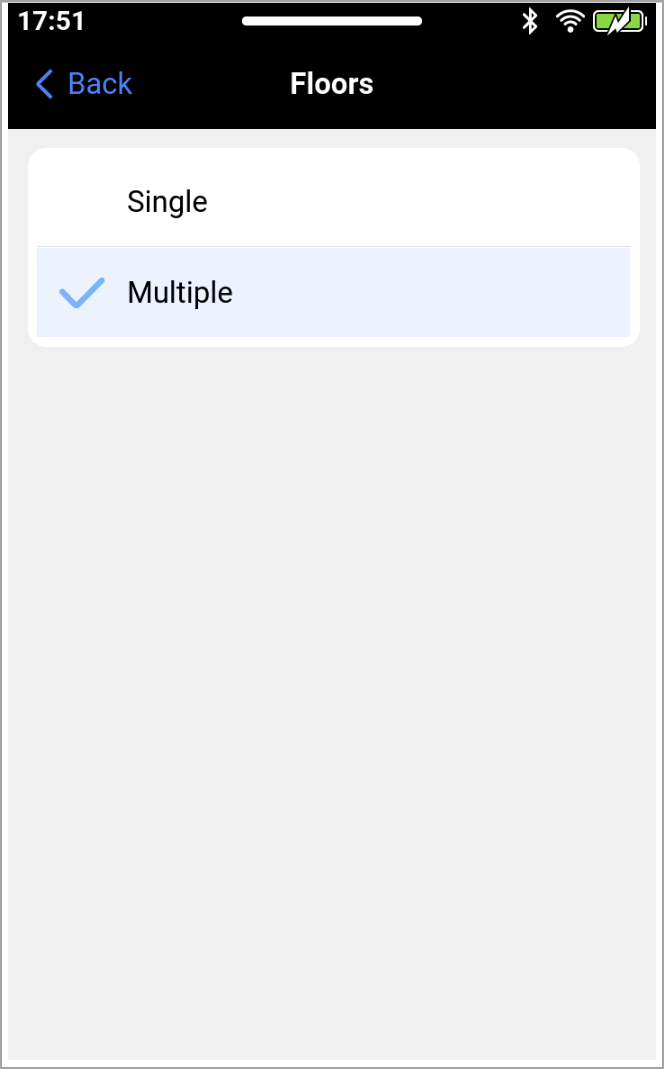
Single floor: When Single Floor is selected, one map is used for the heatmap test.
-
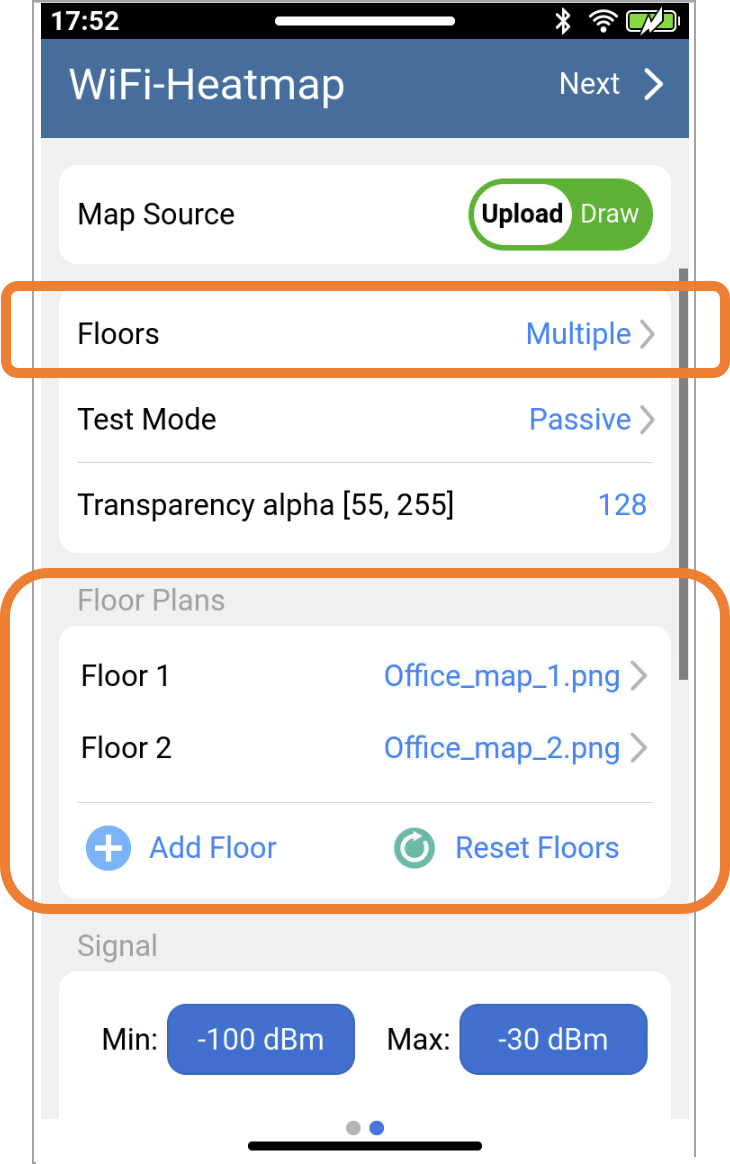
Multiple floor: When Multiple Floors is selected, a specific map can be assigned to each floor. During the test, switch between floors and collect measurements on the corresponding map.
Test Mode
-
Passive: Use when no direct connection to an access point is required.
-
Active: Available in a future release.
Set the Transparency alpha for the amount of opacity in the heat map colors. The higher the number the darker the shade.
Measurement Settings
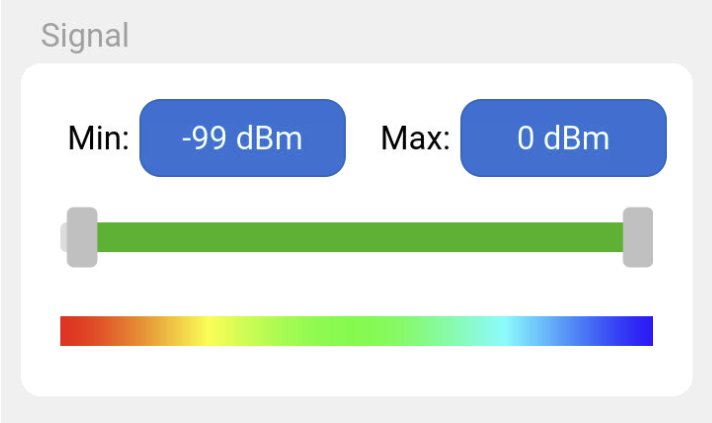
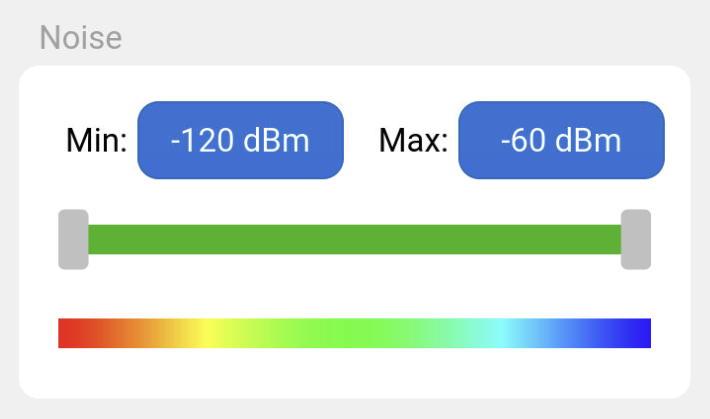
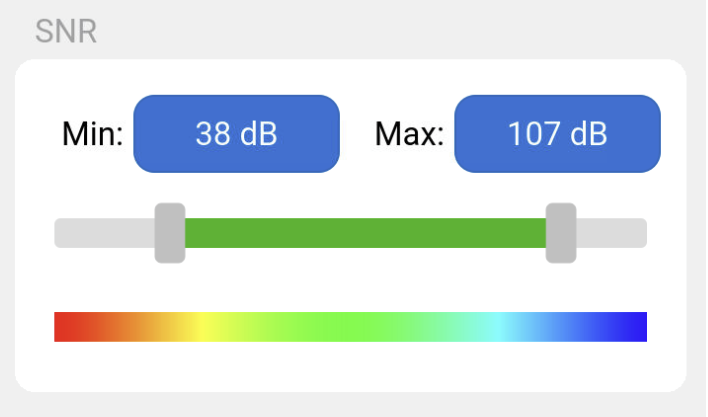
Signal, Noise, and SNR (Signal-to-Noise Ratio) range settings can be configured for the heat map. Select the Min/Max fields to enter the range or use the slider bar from both ends to choose the range. The color bar represents the colors for the full array. After setting the range, the section of the color bar that lines up between the two end point of the range will be used on the heat map.
Recalibration
When finished with the configuration screen, select Next. A prompt appears asking if the site dimensions should be recalibrated.
For the distances to be accurate, the device needs a reference point for scale. Draw a line between two known points on the imported floor plan, then enter the actual distance. Everything else is calculated from that ratio. If the scale looks off, it can be overridden manually.
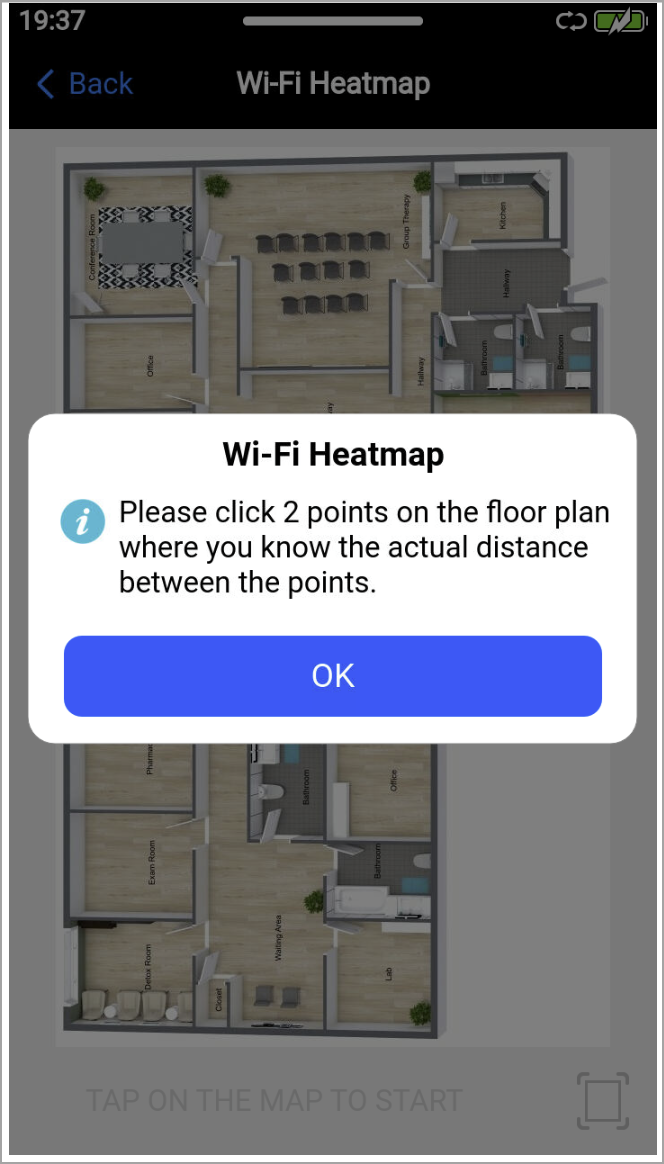
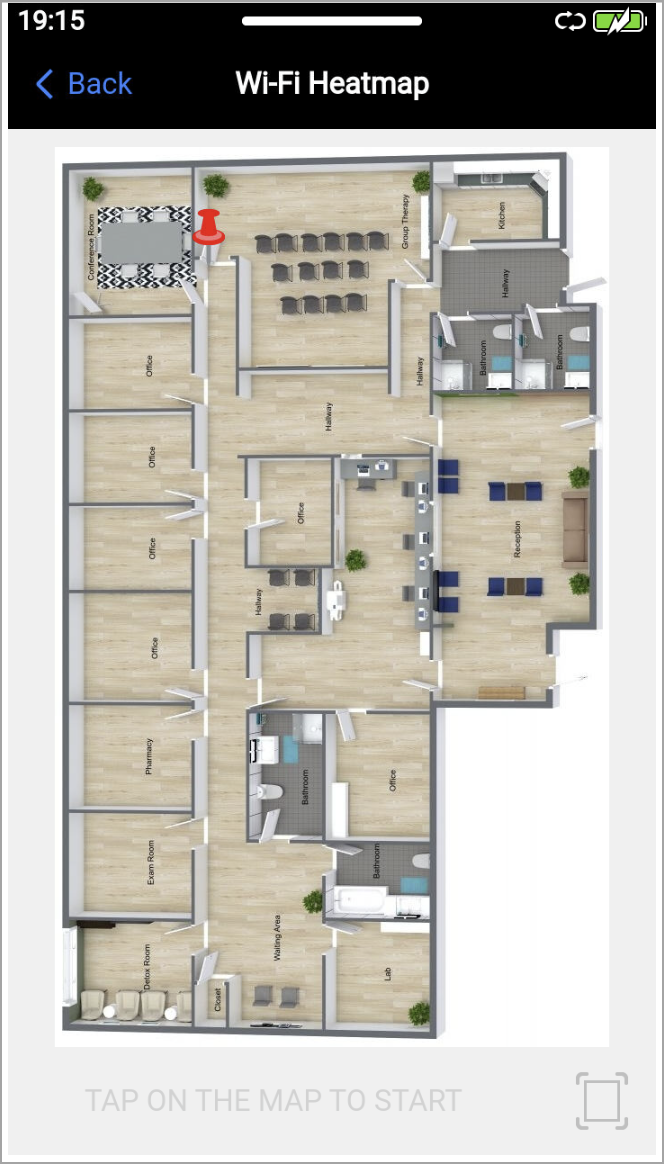
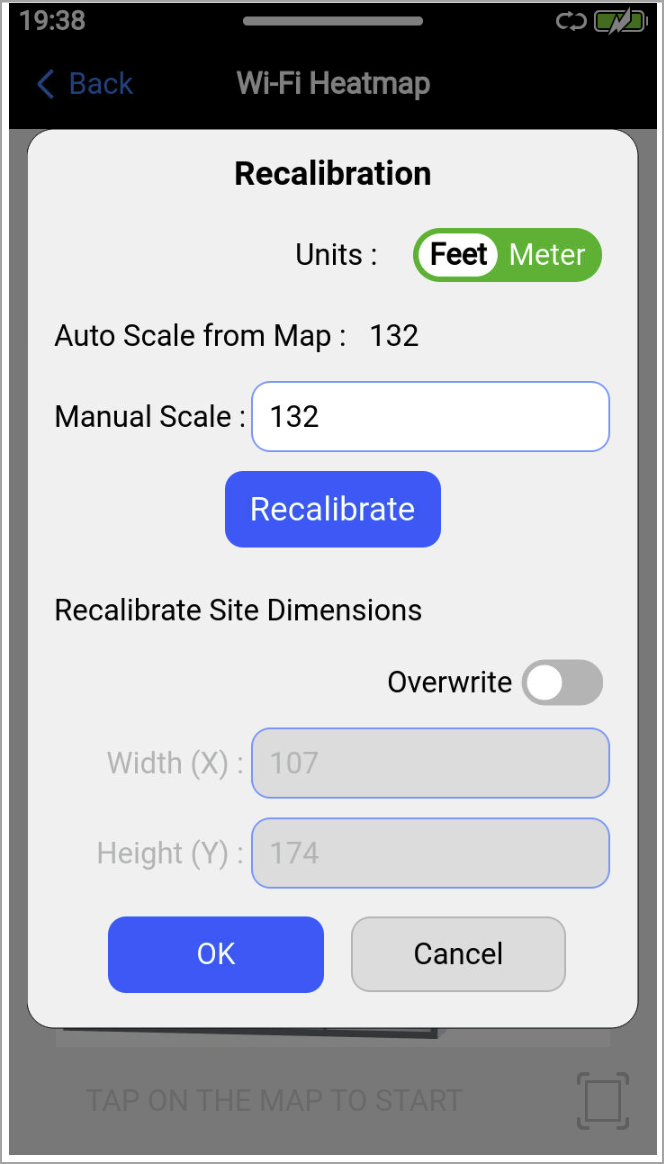
Enter the actual distance between the two selected points on the map in feet or meters, then select OK.
Access Points
Select the access points to measure. The Filter AP screen can narrow down the list to show specific access points.
Use filters to display only the desired access points. Filters can be applied by SSID, BSSID, 802,11 standard, and channel, and multiple filter criteria can be combined.
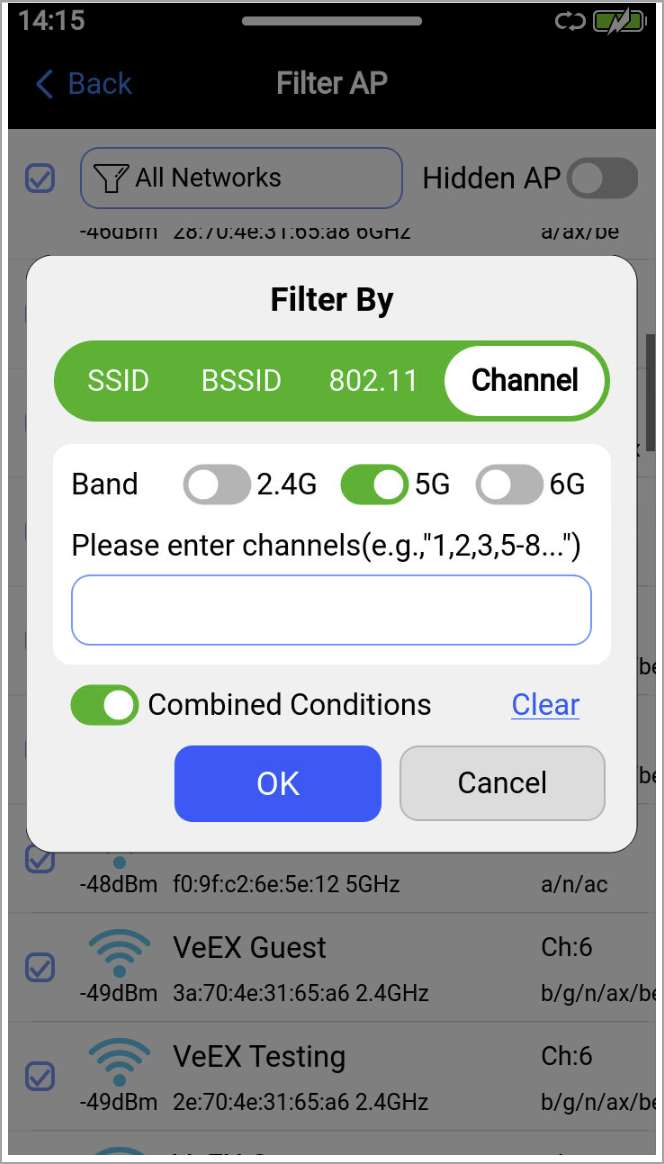
AP List Filter Options
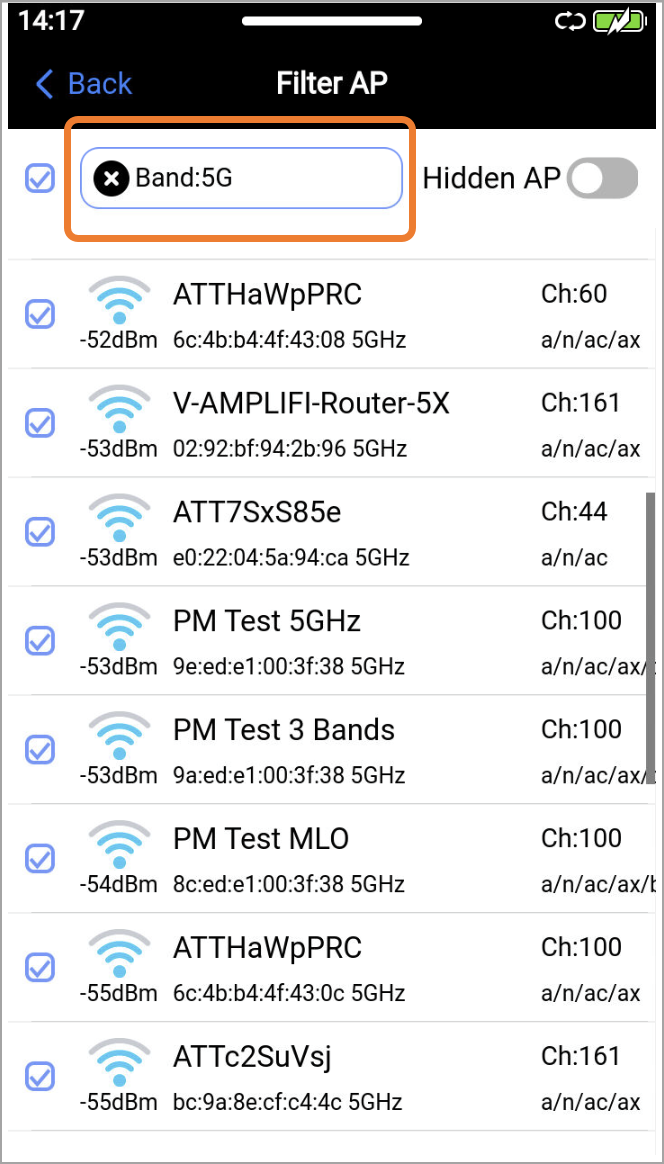
Filtered AP List
Select Back when finished to see the Map screen and begin collecting measurements.
Operation
 Choose at least two points for the heat map to generate accurate coverage. Place one test point near the AP and another further away to improve interpolation across the measured area. Choose at least two points for the heat map to generate accurate coverage. Place one test point near the AP and another further away to improve interpolation across the measured area. |
-
Tap the map to begin. Double-tap to place the first test point.
-
If signal data is not collected automatically, tap
 Record.
 -
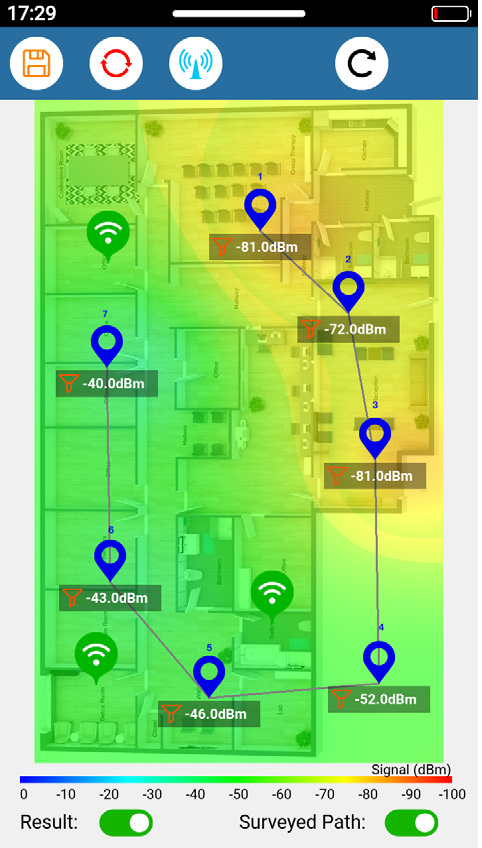
Walk the space with the test set, collecting signal measurements at each test point. The heat map estimates signal values between measurement points, with locations closer to a measurement point influenced more strongly by that point's signal strength. This creates smooth color transition across the map instead of abrupt changes. At each measurement point, the test set compares signal strength across all selected APs and plots the strongest signal. The resulting heat map highlights areas with strong coverage, weak coverage, and potential dead zones.
-
When finished, tap
 Save at the top of the screen and enter the filename for the results.
Options
-
Result: Shows/Hides the measurementspoints on the map.
-
Surveyed Path: Shows/Hides the recorded walking path.
|
|
Records the measurements and walking path along the map. |
| |
Saves all recorded measurements into a single consolidated report. |
 |
Restarts the test from the beginning. All previously recorded measurements will be lost. |

|
Restarts the test for the current location. All measurements for this location will be lost. |

|
Undoes the previous action. |

|
AP Marker allows the user to drag and drop access point markers onto the map for graphical representation only. The merakers help correlate measurement results with AP locations and do not affect the heat map calculations. |
Measurement Views
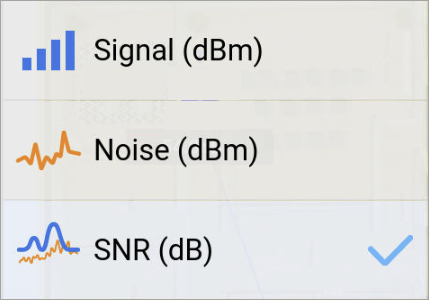
On the top left of the Map screen, select the menu icon  and choose which measurement to show on the map.
-
Signal: Shows where the AP reaches.
-
Noise: Shows where interference is hiding. A range of -95 to -85 dBm is expected usually. Any reading above -75 dBm indicates interference.
-
SNR: Shows where the best experience will be. A ratio of 25 dB or above is considered reliable; below 15 dB is poor.
Wi-Fi Heatmap Test Report
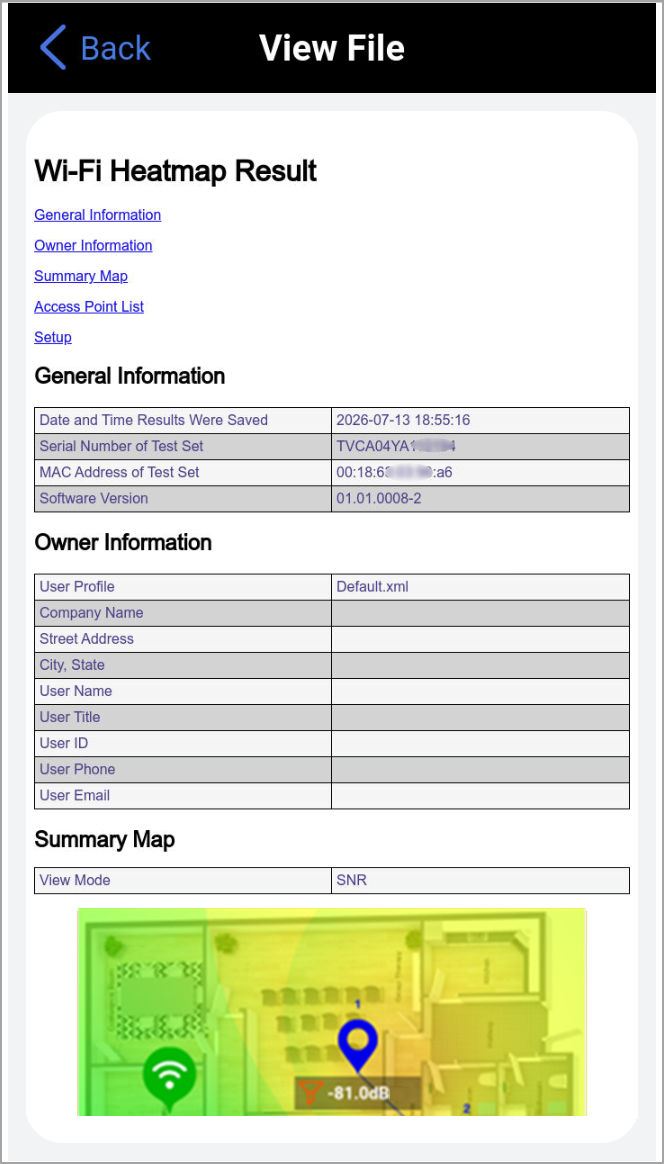
After saving results from the Heatmap Test, swipe down and select  Files to see the report.