Events Tab
The analysis results are trace events. They are marked on the trace with the marks showing the event types (![]() for fiber beginning,
for fiber beginning, ![]() for splice loss,
for splice loss, ![]() for fiber end, etc.) Full event details are provided in the event table on the bottom, the span beginning and end are marked with brackets (see below).
for fiber end, etc.) Full event details are provided in the event table on the bottom, the span beginning and end are marked with brackets (see below).
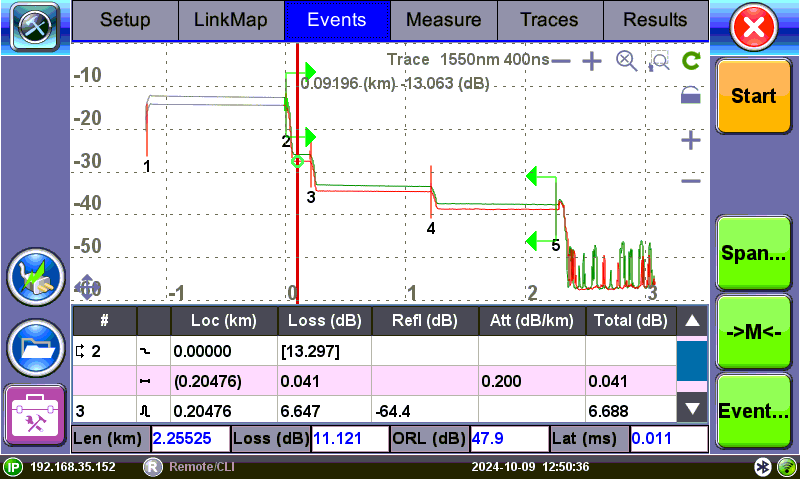
Events Tab: Trace with event table
|
|
A measuring pulse is extended in time and hence along some fiber span. As a result, there is always a dead zone at the beginning of the fiber where an OTDR cannot detect any events. A longer pulse width increases the dynamic range because it is more powerful, but it also results in a longer dead zone. |
Events Table
The Events table is available in all measurement modes. Select the Events tab to display the trace with events. The Event table displays all events found during the analysis including those added manually.
To view contents of a merged event, double-tap the Event table.
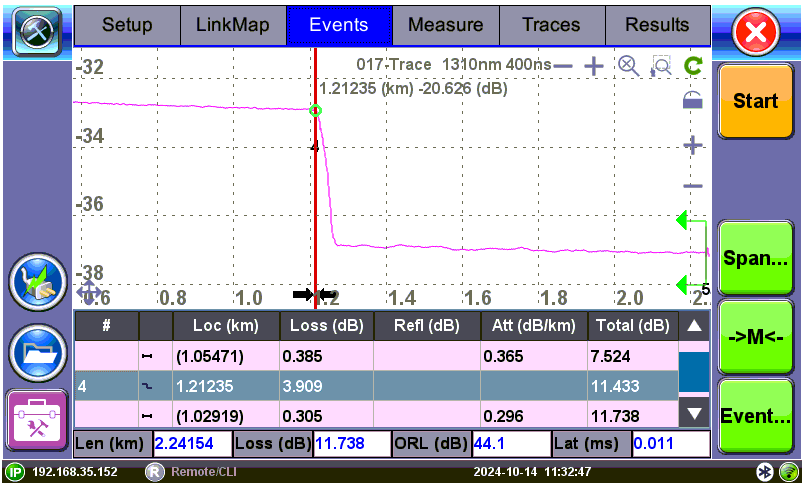
Events table with failed event highlighted
The Events table is displayed automatically when the Events tab is selected. It can be minimized by tapping the plus symbol just above the left of table. This optimizes the display area and allows better viewing of the OTDR trace.
Use Up/Down arrows to navigate the event table and to display or move to the highlighted event.
Use the green Left/Right arrows to move the marker between the start and end of fiber being tested.
To maximize the Event table, select the cross symbol again.
![]() The right green brackets (Span Start) indicate the 0km location and the left (Span End) is the end. The reported total loss and ORL is from this area of the trace only. For example, if there is a 1000m launch cable between the OTDR and FUT, then the Span Start of 0km is set at the end of 1000m.
The right green brackets (Span Start) indicate the 0km location and the left (Span End) is the end. The reported total loss and ORL is from this area of the trace only. For example, if there is a 1000m launch cable between the OTDR and FUT, then the Span Start of 0km is set at the end of 1000m.
Event Types
| Symbol | Event Type | Description |
|---|---|---|
|
|
Start of fiber | Start of the fiber under test. |
|
|
End of fiber | End of the fiber under test. |
|
|
Fiber section | Fiber section with attenuation. |
|
|
Reflective Event | Event with both loss and reflectance – typically caused by a crack, connection, or mechanical splice. |
|
|
Non-reflective Event | Event with loss but without reflectance – typically caused by a fusion splice, macrobend, or PON splitter. |
|
|
Gainer | Event with 'negative loss' as viewed by the OTDR – typically occurs when two fibers with different backscatter coefficients are spliced together. Usually a gainer will be seen as a normal event with 'positive' loss when tested from the opposite end of the fiber. |
|
|
Merged Event | Event that consists of two or more real events that are spaced too close together to be resolved or measured by the OTDR. |
Event Editing
|
|
Adding events:
- Ensure the Trace menu is active and the Event table is shown on the screen.
- Position marker at the point where a new event will be inserted.
- Tap Event<Add on the right sidebar. A new event number will appear on the trace and in the event table.
- Select the new event in the event table and tap Event<Edit on the right sidebar. Position the splice loss markers to measure the new event accurately. Once markers are positioned, tap the Accept button.
To analyze the new event, tap Analysis before accepting.
Tap Cancel to exit the menu without saving changes.
Deleting events:
- Select the event in the event table.
- Once selected, tap Event<Delete on the right sidebar. The event will be deleted from the event table and the event number will no longer appear on the trace.
Modifying events:
- Ensure the Trace menu is active and the event table is shown on the screen.
- Select the event in the event table.
- Tap Event<Modify on the right sidebar. A marker with two small markers will appear on the trace. When markers and measurement is performed, click the Accept button on the right sidebar. To analyze the event, click Analysis before accepting. Click Cancel to exit the menu without saving changes.
- Span Begin – Position the marker at the end of the Launch fiber and tap the green Span Begin button to set the beginning of fiber under test (indicates 0km location).
- Span End - Position the marker at the end of the fiber under test and tap the green Span End (if launch box is used).
- Span Edit - Edit launch and receive cable information (length, event loss, compensated loss).
- Markers - Displays marker.
- Event – Add, delete, or make manual adjustments to the event table and reanalyze.
Event Troubleshooting
If a KNOWN event does not appear, try the following:
Check an adjust Analysis threshold levels.
If testing Long Fiber, make sure the range > FUT (fiber under test); increase time to 3 minutes. The range should be set at about twice the length of the FUT to prevent ghosts caused by reflections.
Change the test mode for which to optimize. For example, if optimizing for DZ mode, change to DR and vice versa.
Use V-Scout. (Refer to V-Scout.)