Results - Standard Mode
The progress and current result of the RFC 2544 can be viewed as the test is in progress.
Results tab
Navigate the respective sub-tabs (throughput, latency, frame loss, or burst) to view the results for each test. For the burst test, the results can be viewed in summary table format or test log format.
Status tab
The status of each test is displayed including a stamped log of each test.
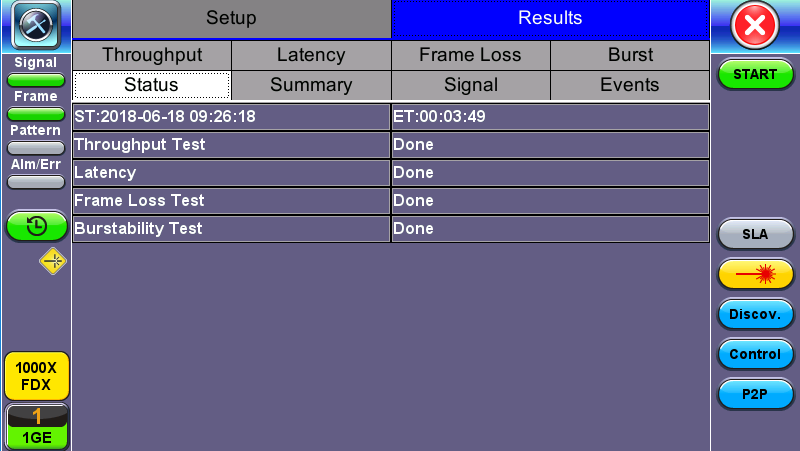
RFC 2544 Results - Status
Summary tab
The following results including the Start (ST) and Elapsed (ET) times are displayed:
- Line Rate (Mbps): Negotiated rate of the interface (10M, 100M, 1000M or 10GE). This value is always fixed since it depends on the maximum capacity of the link under test, hence the test interface that is configured.
- Framed Rate: (Payload + MAC/IP Header + VLAN Tag + Type/Length + CRC) / (Payload + Total Overhead) * Line Rate % (in Mbps).
- Data Rate: Payload / (Payload + Total Overhead) * Line Rate %.
- Utilization: % of Line Rate. For example, if we transmit 100Mbps on a 1Gbps interface then the utilization value is 10% (or 100Mbps) of the total link capacity (or Line Rate).
- Total Frames
- Bad Frames
- Pause Frames: Total number of transmitted and received ethernet pause flow-control frames.
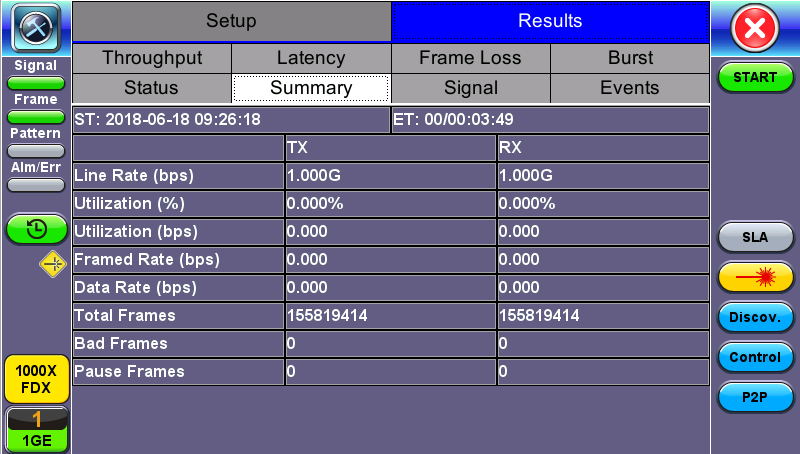
RFC 2544 Results - Summary
Signal tab
The Signal tab (fiber ports only) displays the optical level measured by the SFP transceiver. The RFC 2544 Signal tab is identical to the Signal tab for the BERT application. Refer to Lane BERT Signal for more information.
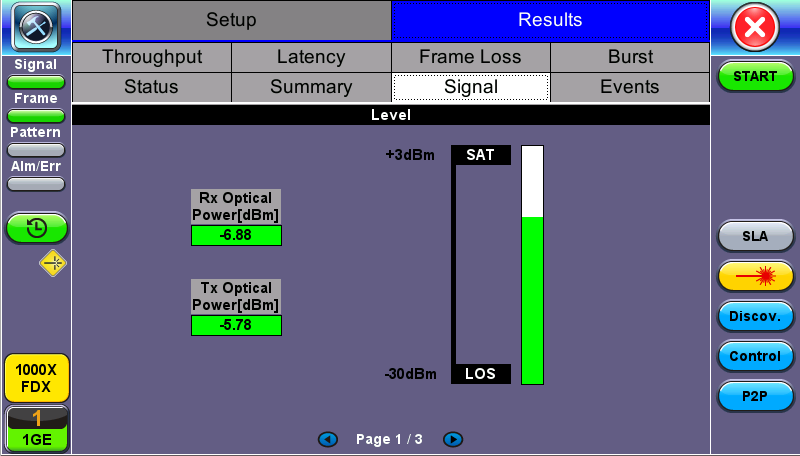
RFC 2544 Results - Signal (Page 1)
Events tab
A time stamped log of each test is displayed.
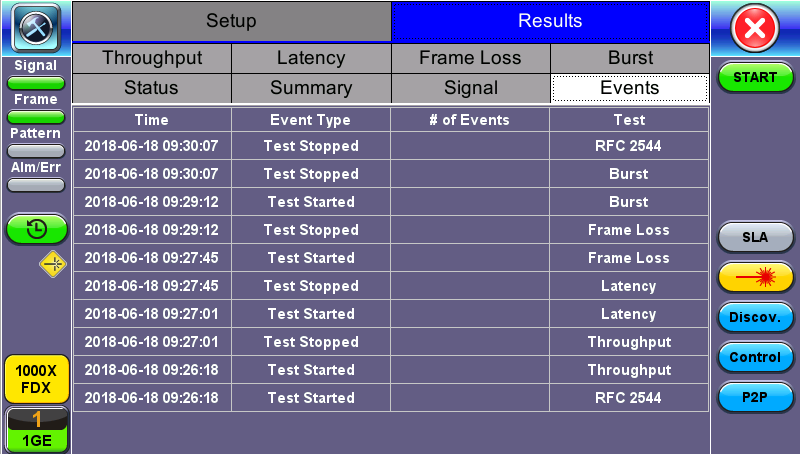
RFC 2544 Results - Events
Throughput tab
The Throughput tab displays the maximum throughput rate of the link under test. Results are displayed in graphical and table formats. Use the drop-down menu to change the display format.
- Graphical: Throughput results are displayed in a bar graph form
- Summary table and test log table display:
- Byte size
- Tx(%): Percentage of test frames transmitted by the unit
- Rx(%): Percentage of test frames received by the unit
- Thresholds: Pass/Fail test status determined by test criteria set in the Threshold tab
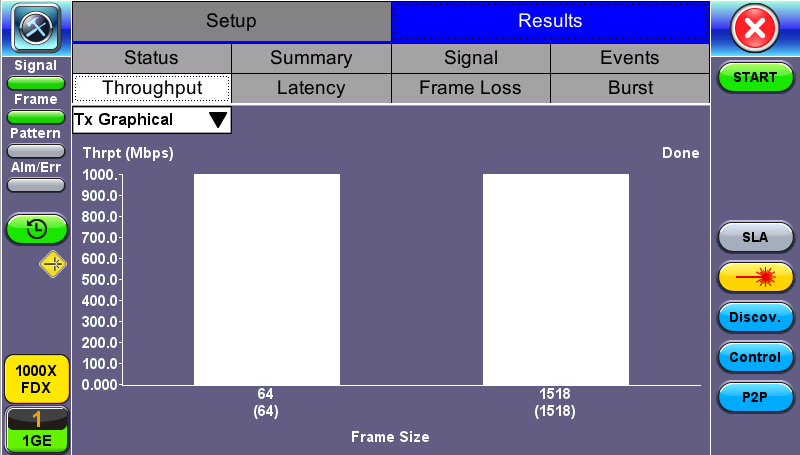
RFC 2544 Results - Throughput (Tx Graphical)
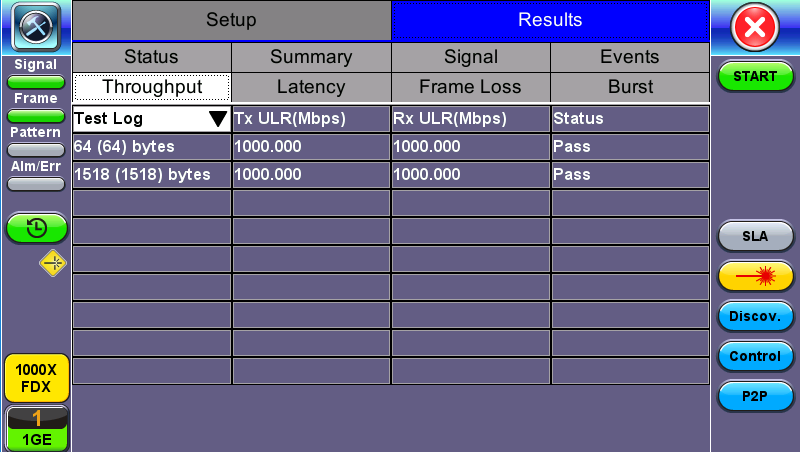
RFC 2544 Results - Throughput (Test Log)
Latency and frame jitter measurements results are displayed in the following formats. Use the drop-down menu to select the Latency format:
- Graphical: Latency results displayed in line graph form (Latency [us] vs Frame size [bytes]).
- Summary and Test log tables display:
- Byte size
- Latency (us): Round trip delay latency.
- Rate (%): Percentage of frames transmitted. Data rate used for latency test.
- Pass/Fail test status.
RFC 2544 Results - Latency (Summary)

RFC 2544 Results - Latency (Graphical)
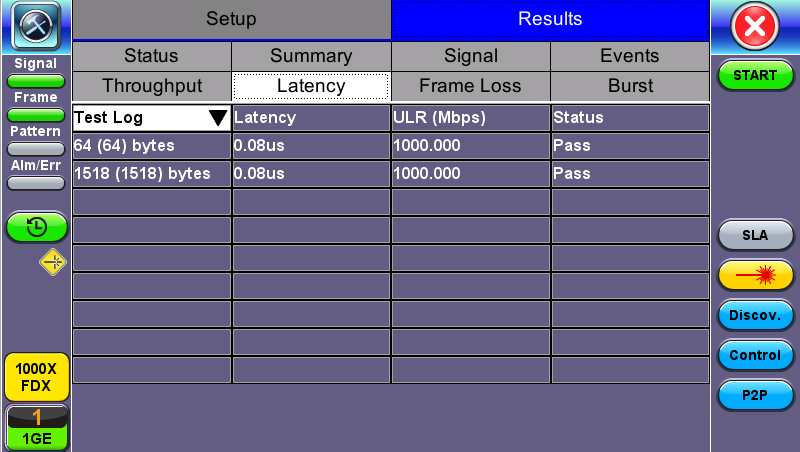
RFC 2544 Results - Latency (Test Log)
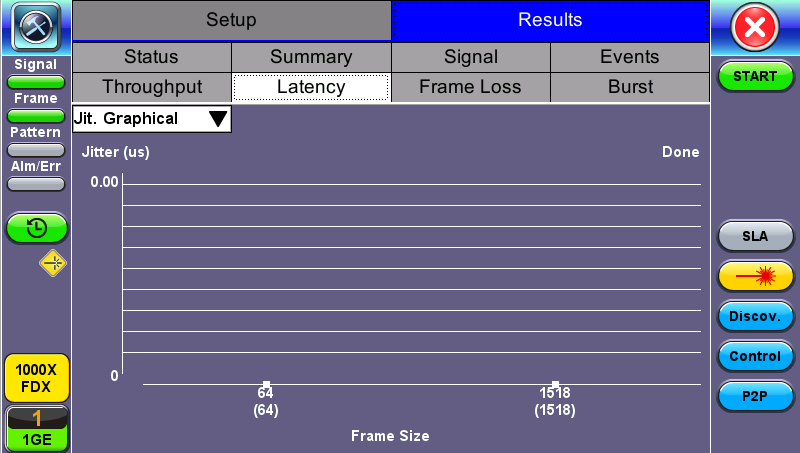
RFC 2544 Results - Latency (Jitter Graphical)
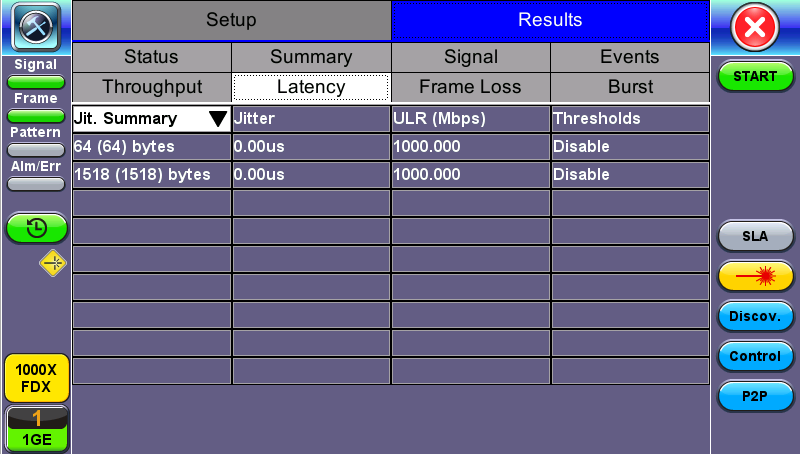
RFC 2544 Results - Latency (Jitter Summary)

RFC 2544 Results - Latency (Jitter Test log)
Frame Loss tab: Frame loss displays the percentage of frames not received. Use the drop-down menu to select the Frame Loss format:
- Summary and Test log tables display test frame length, byte size, frame loss (%) from received traffic, and rate (%) transmitted.
- Graphical: Frame Loss displayed in line graph form (Frame size [bytes] vs Rate [%]). Tap on the Graphical Type drop-down menu on the right to view the graph legend.
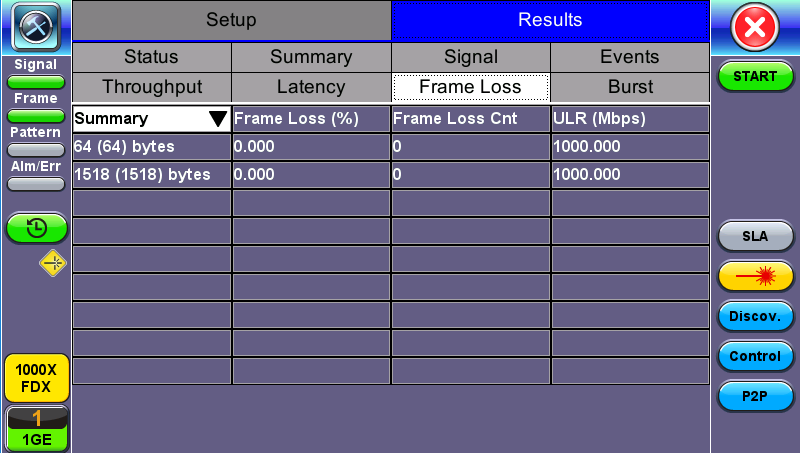
RFC 2544 Results - Frame Loss (Summary)
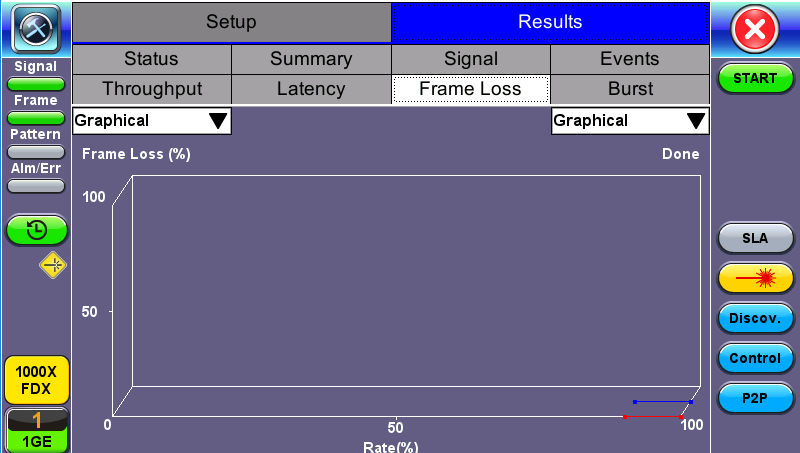
RFC 2544 Results - Frame Loss (Graphical)
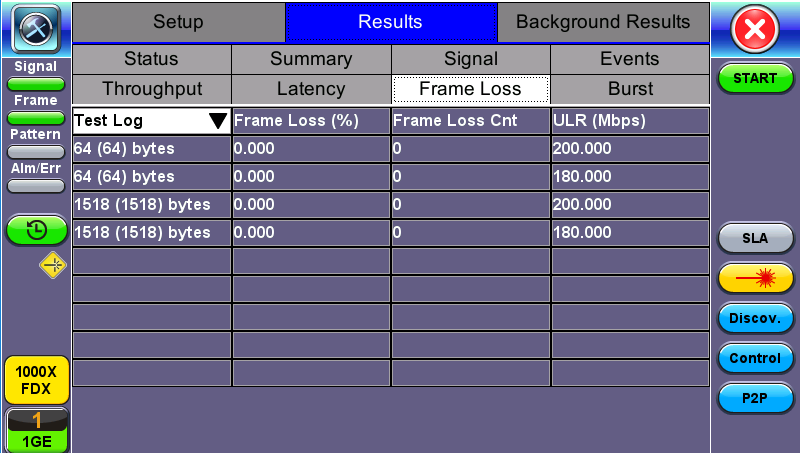
RFC 2544 Results - Frame Loss (Test log)
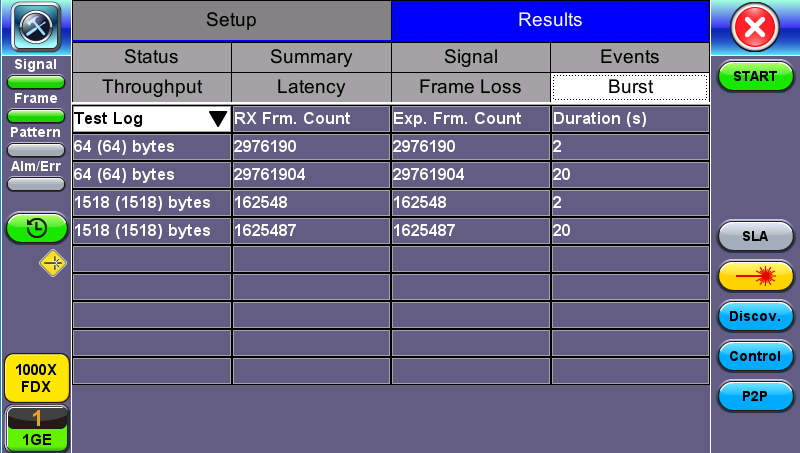
Burst tab: Burstability (back-back) results are the number of frames successfully transmitted/received at the line rate. It is displayed in the following formats:
- Summary table: Displays Average Frame Count received for each test frame length
- Test log table: Displays Average Frame Count and Duration (seconds) for each test frame length
RFC 2544 Results - Burstability (Summary)
RFC 2544 Results - Burstability (Test Log)