Link map
The trace can also be presented as a simplified map of events with the help of the advanced system algorithm.
Select ![]()
The link map view presents a simplified view of measurement results by analyzing all the event table results for each pulse, whether using single or multiple pulse widths, and all test wavelengths. A span summary is displayed, in the form of a block diagram, for each test wavelength shown at the bottom of viewing window.
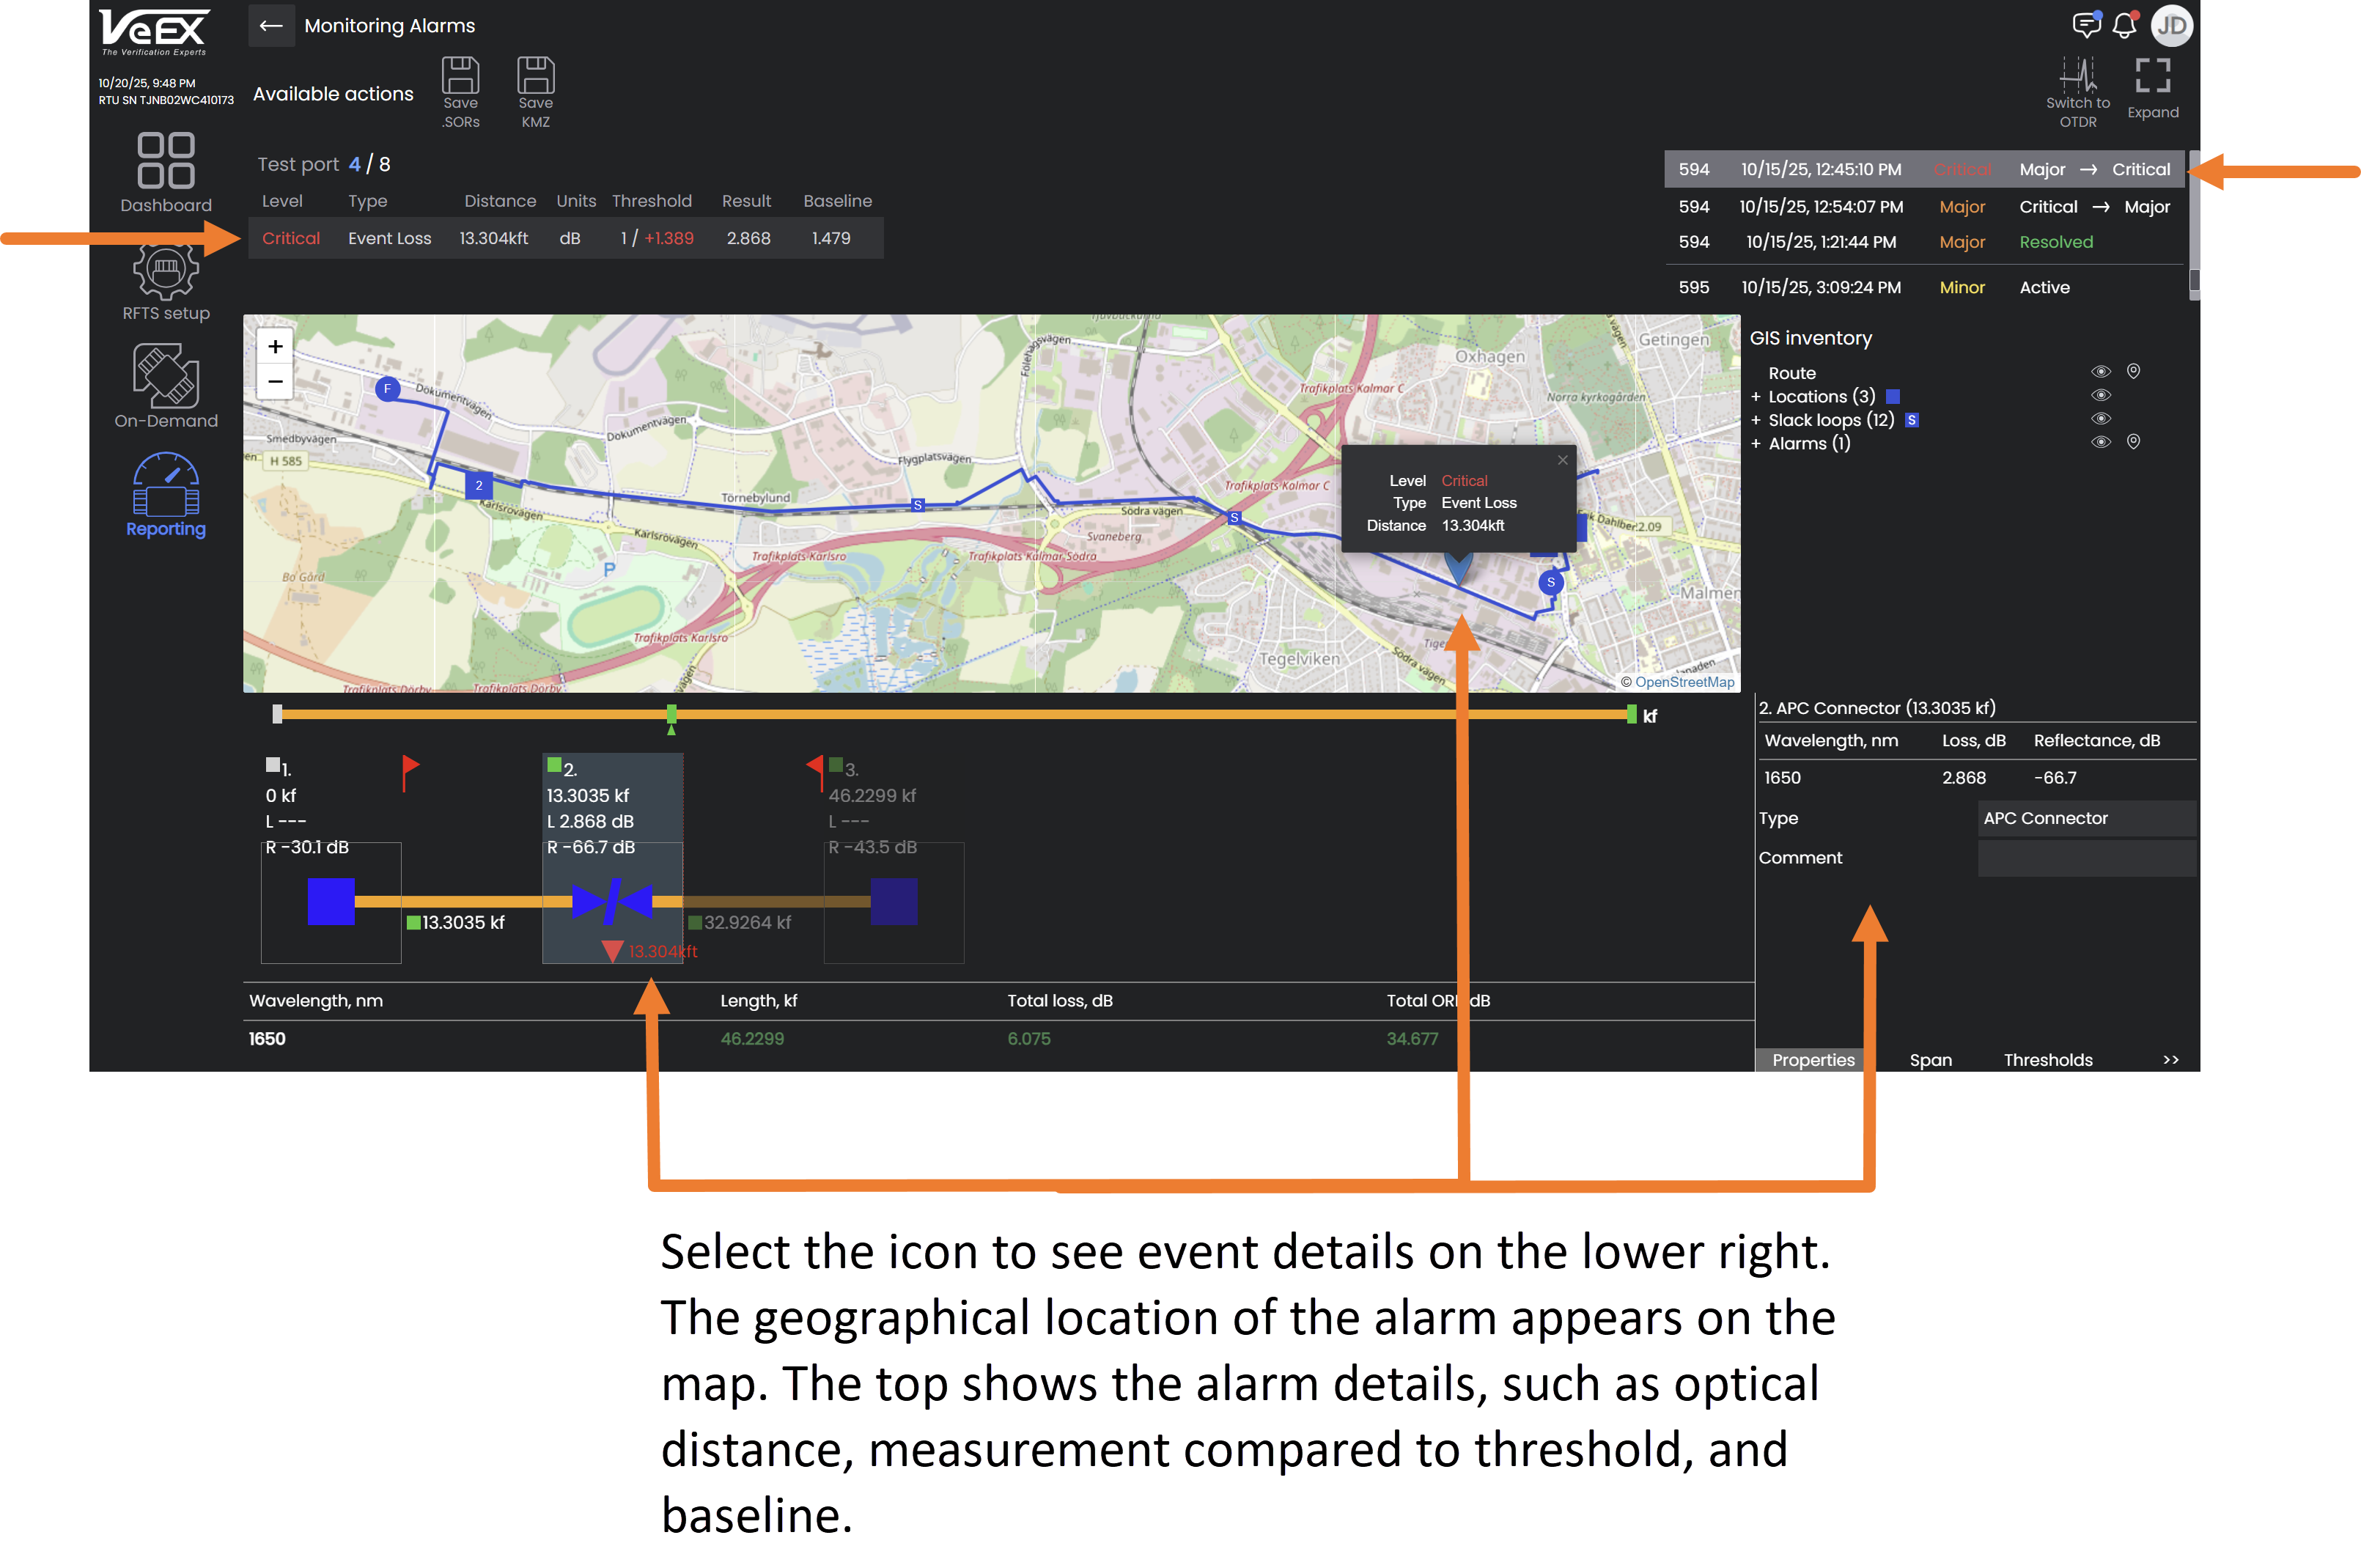
Select an icon to obtain more information about that specific event on the fiber.
When an event icon is selected, the event details are displayed in the lower right. The geographical location of the alarm appears on the map. The top shows the alarm details, such as optical distance, measurement compared to threshold, and baseline.
|
|
The link visibility can be significantly improved by using multiple pulse widths to provide better event details. |
Link map symbols
The table below summarizes the symbols used to represent various events on the fiber link.
| Icon | Description |
|
|
Span start (OTDR port) Indicates start of analysis section, as defined in setup. |
|
|
Fiber section |
|
|
End of Span end Indicates start of analysis section), as defined in setup (distance or event index). |
|
|
Optical Connector/Physical contact (reflective event) |
|
|
Unknown Event - Distance Range or Dynamic Range inadequate to detect TRUE end. |
|
|
Blank Node |
|
|
Optical Connector - APC (Angled Polish) (reflective event) |
|
|
Splice (non-reflective event loss or gainer) |
|
|
UPC connector |