Trace Analysis
The system analyzes traces automatically, according to the thresholds selected in the alarm profile. OTDR measurement results can be represented in traditional trace and event table, or shown as an automatic iconic R-Server Workflow and Asset Management system diagram.
The link map is an intuitive link and events representation feature. It identifies events and produces automatic and simplified OTDR analysis in a block diagram.
The cleanest trace is usually a combination of long averaging time, large pulse width, and a low resolution. Using the auto mode setting in the system provides the best possible balance of these parameters when measuring the FUT.
Traces
Traces appear automatically when viewing alarm notifications, reference baselines, or doing an on-demand test. After finishing the analysis, generate a report and/or save the trace .SOR file.
|
|
A measuring pulse is extended in time and hence along some fiber span. As a result, there is always a dead zone at the beginning of the fiber where an OTDR cannot detect any events. A longer pulse width increases the dynamic range because it is more powerful, but it also results in a longer dead zone. |
The analysis results are trace events. They are marked on the trace and shown in the right side of the screen with the marks showing the event types (![]() for fiber beginning,
for fiber beginning, ![]() for splice loss,
for splice loss, ![]() for fiber end, etc.) Full event details are provided in the event table on the right, the span beginning and end are marked with brackets (see below).
for fiber end, etc.) Full event details are provided in the event table on the right, the span beginning and end are marked with brackets (see below).
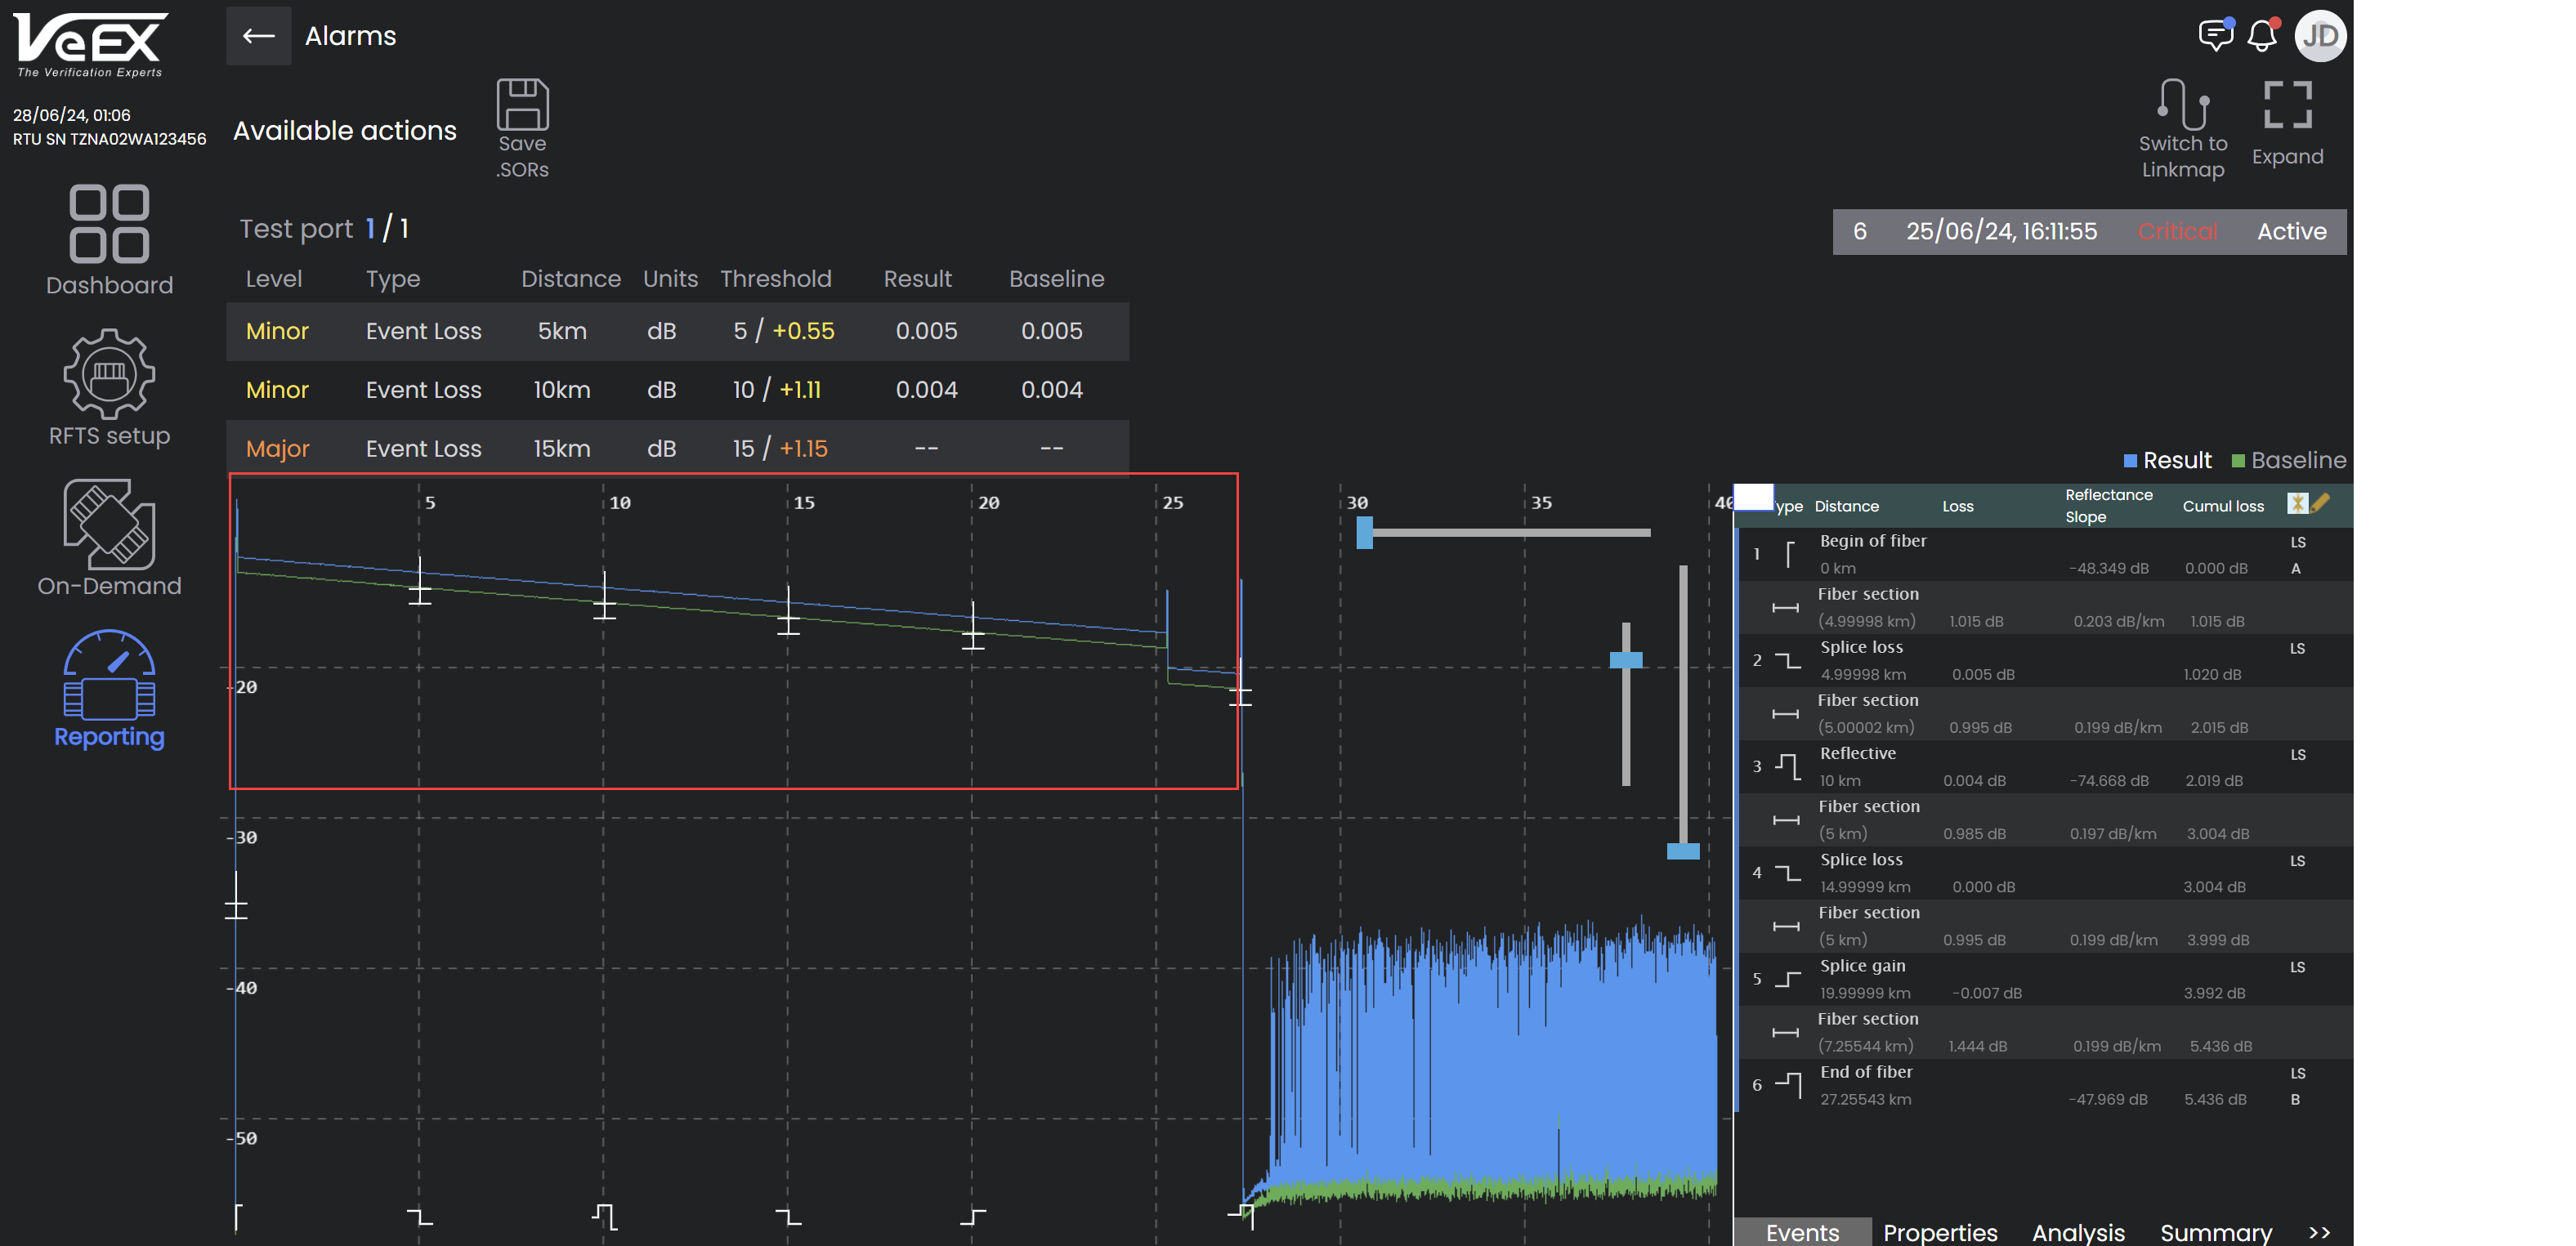
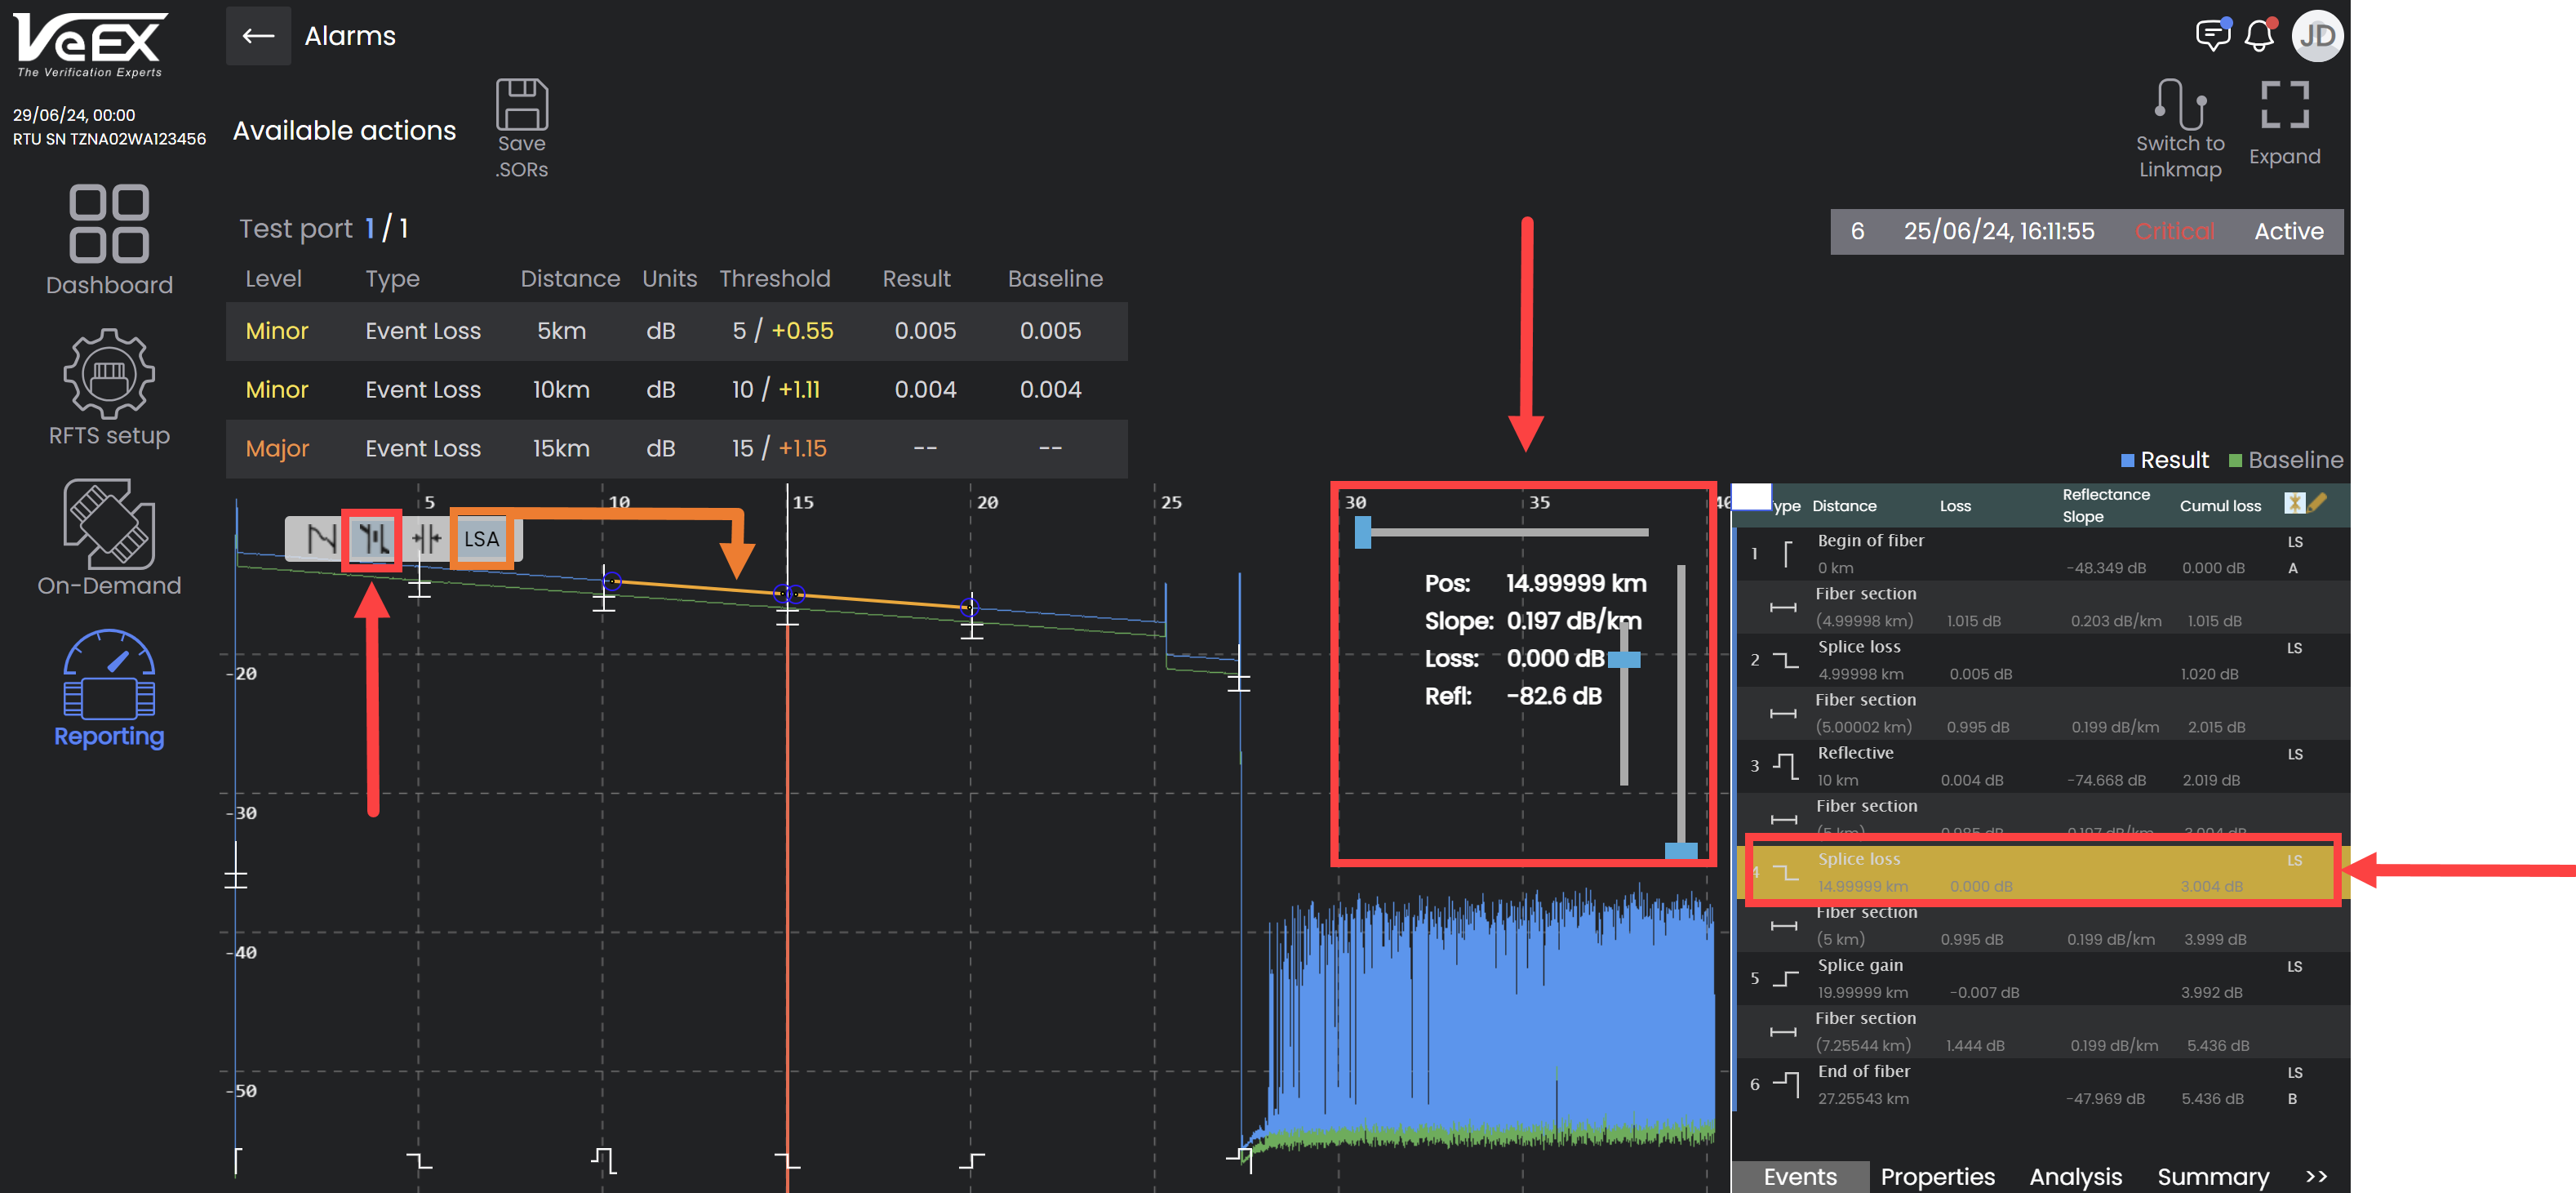
Trace (shown inside red square) associated with critical alarm
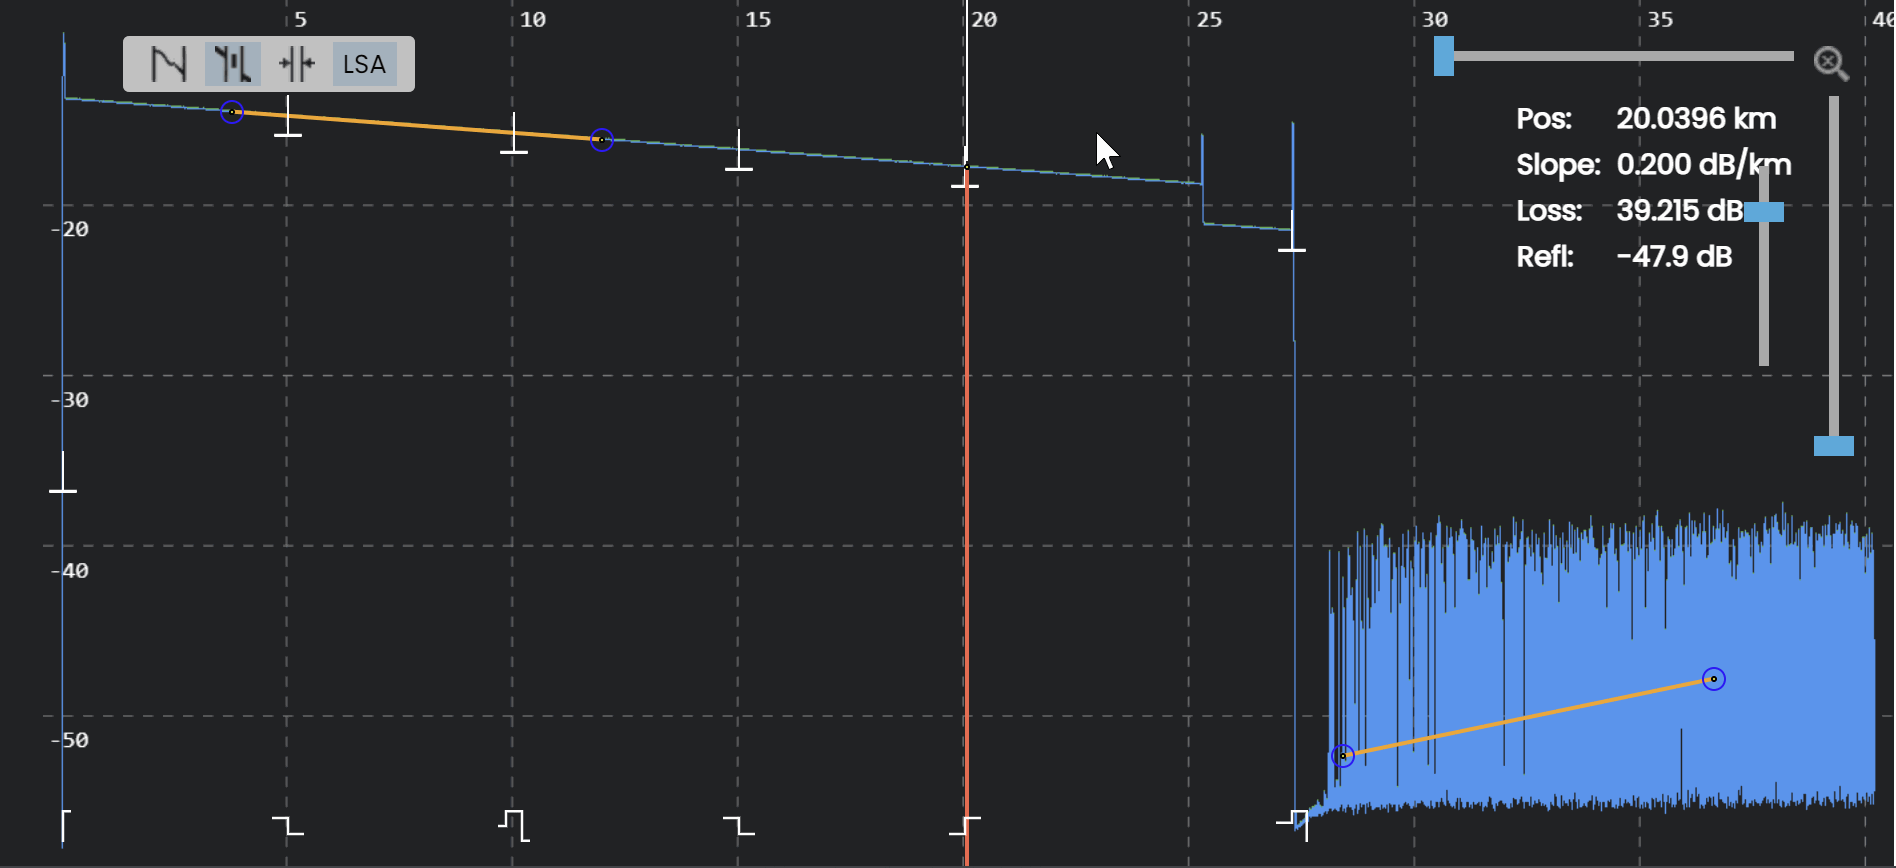
View a fiber location on the trace by clicking on it. Change the trace scale by moving the sliders at the top right corner, separate for vertical and horizontal scaling. To return to 100% view, click the magnifying glass icon (![]() ).
).
Click an event for the system to analyze the trace. The following measurements are provided when measuring a trace:
-
Position: Length of fiber being measured.
-
Slope: Attenuation coefficient of the fiber.
-
Loss: Difference between power levels at either end of the fiber being measured.
-
Reflectance: Amount of light returned from backscatter and from a reflective event e.g. splice, connector, if included in the section being measured.
Loss Measurement Technique
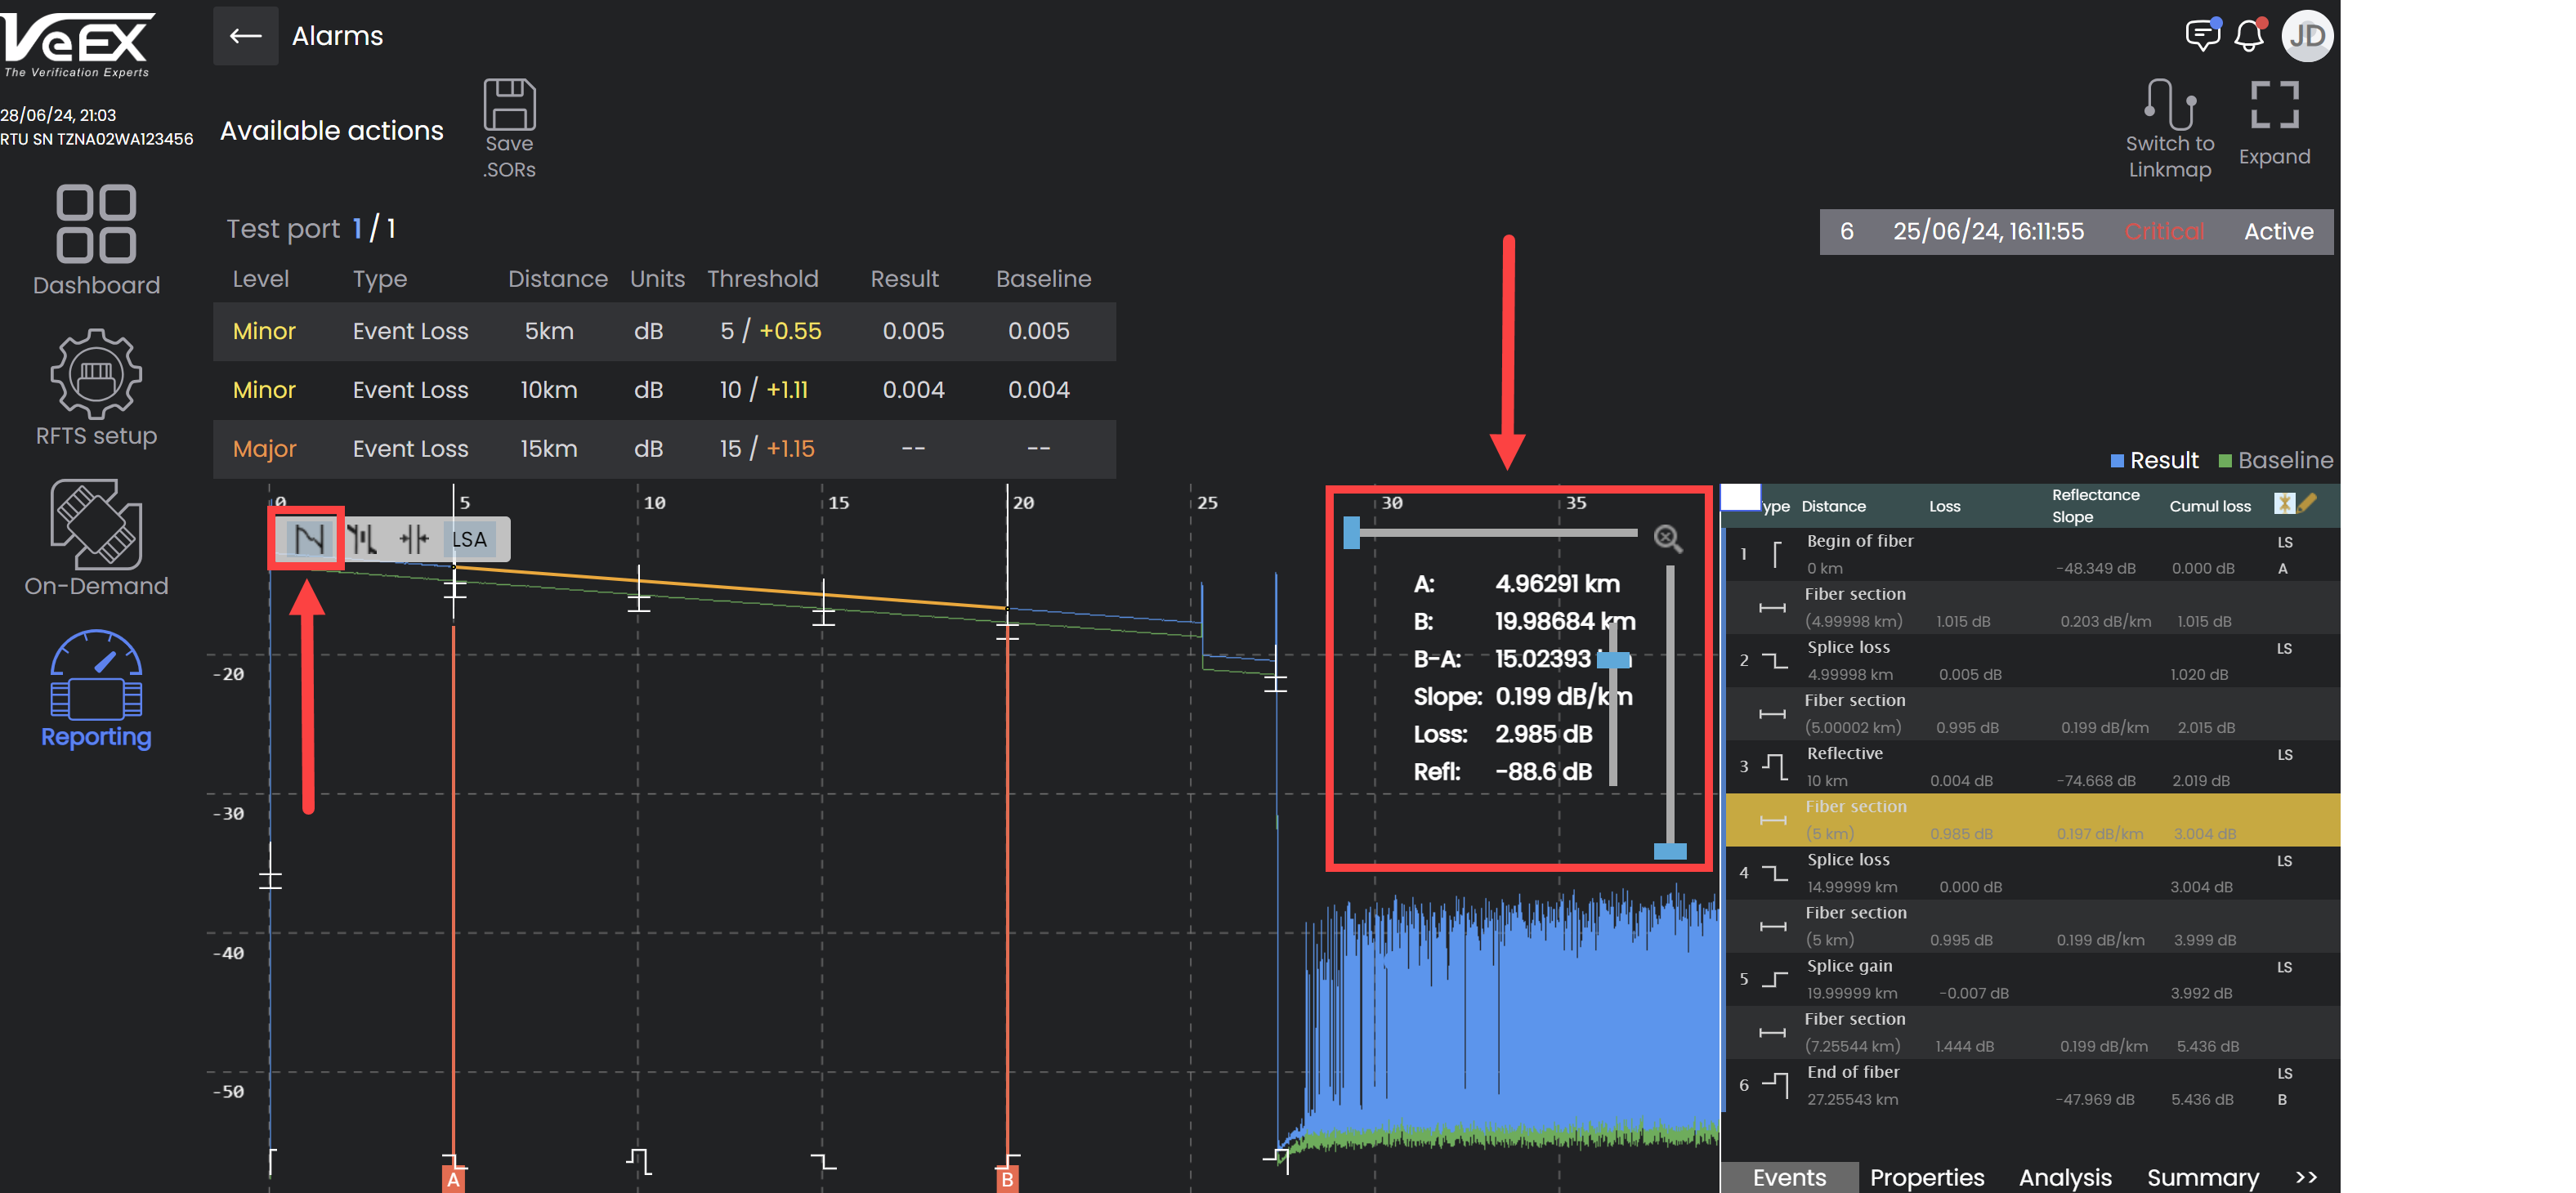
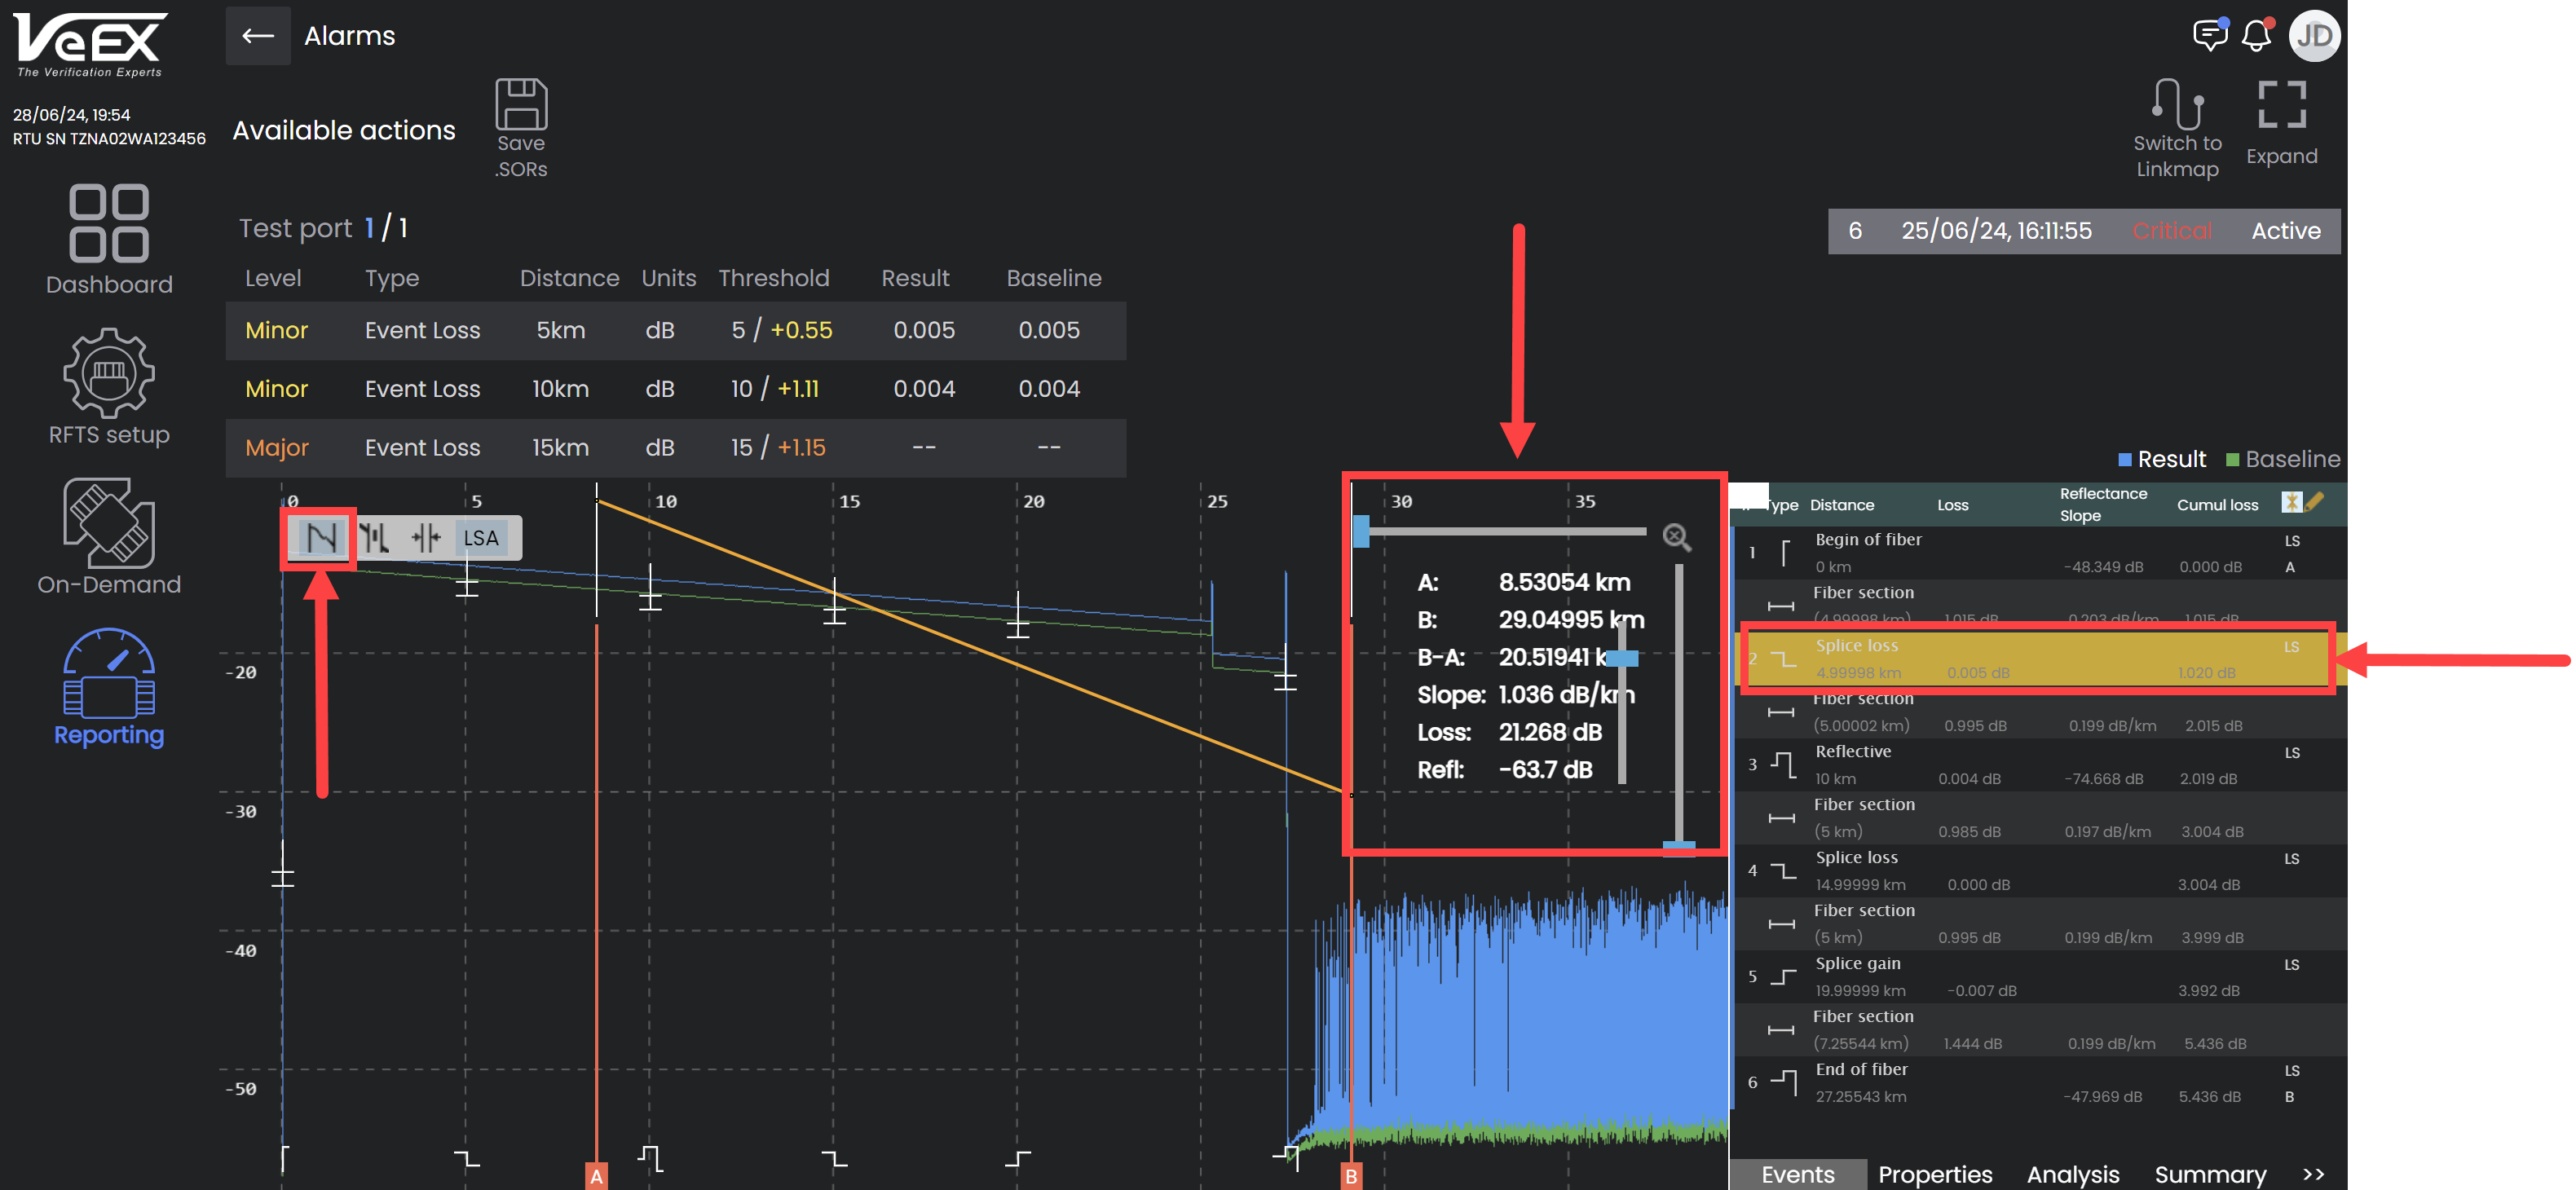
Two types of loss measurement technique can be applied for analysis: 2- marker (![]() ) and 5- marker (
) and 5- marker (![]() ). The markers can be toggled to turn on and off by clicking the corresponding icon.
). The markers can be toggled to turn on and off by clicking the corresponding icon.
|
|
Good Measurement Tips
|
2-Marker Loss Measurement
Using the 2-Marker method, place the markers at each end of the fiber section to be measured. The system measures the distance between the two markers and the difference in power levels where the markers coincide with the trace i.e. loss. The slope or attenuation coefficient is calculated by dividing the computed loss by the distance between the markers. See the illustration below.
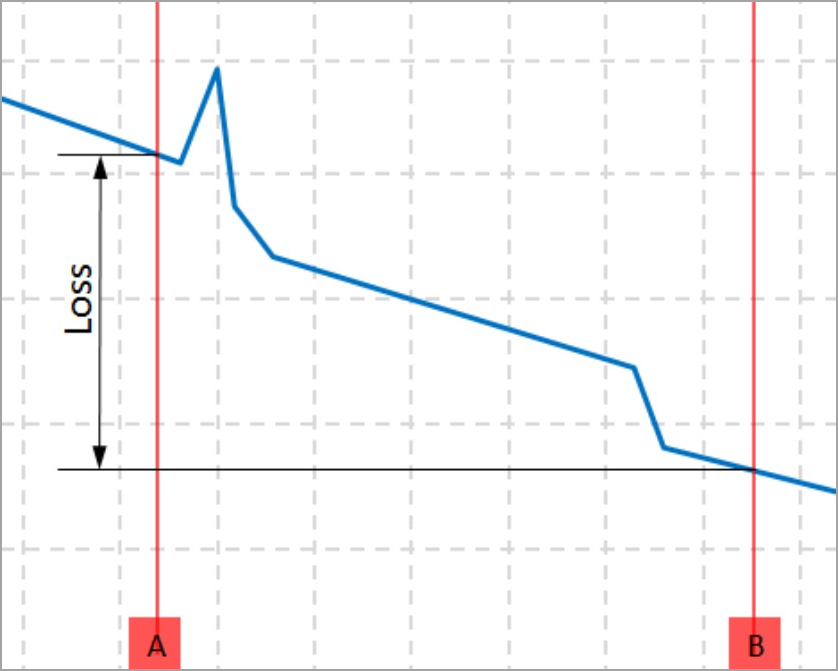
2-marker technique (simplified view)
To use this method, click the 2-marker icon ![]() in the floating toolbar to the left of the trace view. Click the marker at the top where it appears as a white line and drag it to the desired location. The measurements appear to the immediate right of the trace view automatically.
in the floating toolbar to the left of the trace view. Click the marker at the top where it appears as a white line and drag it to the desired location. The measurements appear to the immediate right of the trace view automatically.
2-Marker Loss Measurement of Fiber section including splice
(The result of automatic analysis with the detailed event table on the right.)
To move the markers and analyze a trace event, click the event in the right event panel. The markers encapsulate the part of the trace associated with the event and the measurements appear to the immediate right of the trace. To view another event trace, click another event in the event trace right panel.
The 2-Marker technique includes fiber length, so for splice loss measurements use LSA. Click the LSA icon ![]()
2-Marker Loss Measurement of Splice
To turn off the markers, click the 2-Marker icon again.
5-Marker Loss Measurement
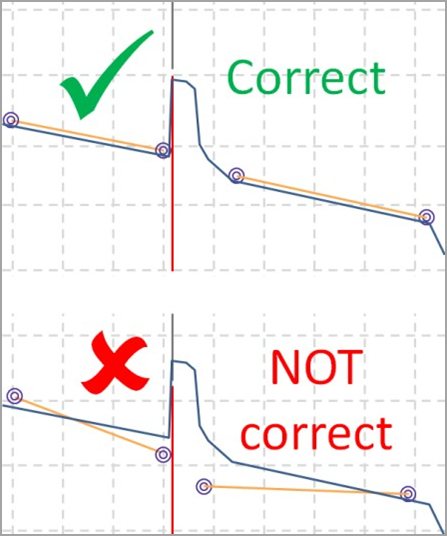
To measure the loss of a splice or a connector, the 5-marker technique is recommended. The system calculates loss by looking at the fiber traces on each side of the event, instead of using fiber length as a factor. It uses the advanced Least Square Approximation (LSA) as a default, to mitigate noise. To use LSA, set markers at each end of the fiber segment, one marker on the peak, and two markers near the event.
5-marker technique (simplified view)
To use this method, click the 5-marker icon ![]()
![]()
5-Marker Loss Measurement of Splice using Least Square Approximation (LSA)
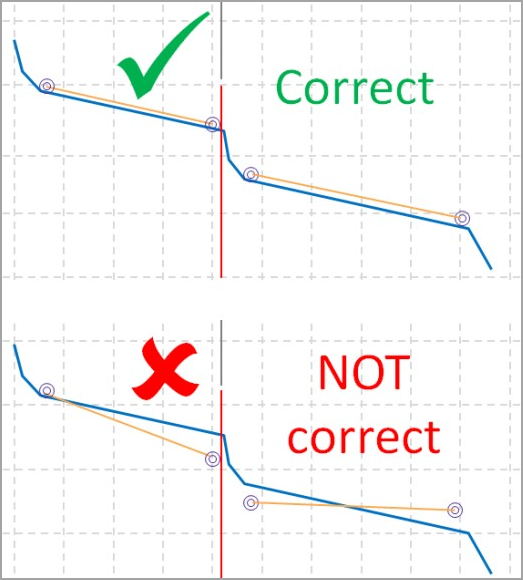
To manually apply the markers, select the longest straight sections and approximate the fiber under test as closely as possible. Avoid sections where the trace is rounded. Keep the lines strictly on the backscatter, even if it is noisy. The central marker must be placed at the very beginning of the event (see the example below).
Marker placement for a connector (simplified view)
To move the central marker together with the other markers, grab its lower (red) part with the mouse pointer and place it where needed. To move the central marker alone (independent of the other markers), grab its upper (gray) part with the mouse pointer and move it. To move any of the side markers independently, grab it with the mouse pointer and move it.
|
|
The event type is determined automatically depending on the markers’ positions. |
Grab and drag to move Markers
To turn off the markers, click the 5-Marker icon again.
The trace can also be presented as a simplified map of events with the help of the advanced system algorithm. Refer to Link map.
Event Troubleshooting
If a KNOWN event does not appear, try the following:
Check an adjust Analysis threshold levels.
If testing Long Fiber, make sure the range > FUT (fiber under test); increase time to 3 minutes. The range should be set at about twice the length of the FUT to prevent ghosts caused by reflections.