Alarms List
The Alarms drop-down list is always accessible from the ![]() icon in the top right corner of the screen. It lists alarms when monitoring tests have detected measurements outside the set thresholds. A red dot
icon in the top right corner of the screen. It lists alarms when monitoring tests have detected measurements outside the set thresholds. A red dot ![]() appears on the icon to indicate when there are alarms available in the list.
appears on the icon to indicate when there are alarms available in the list.
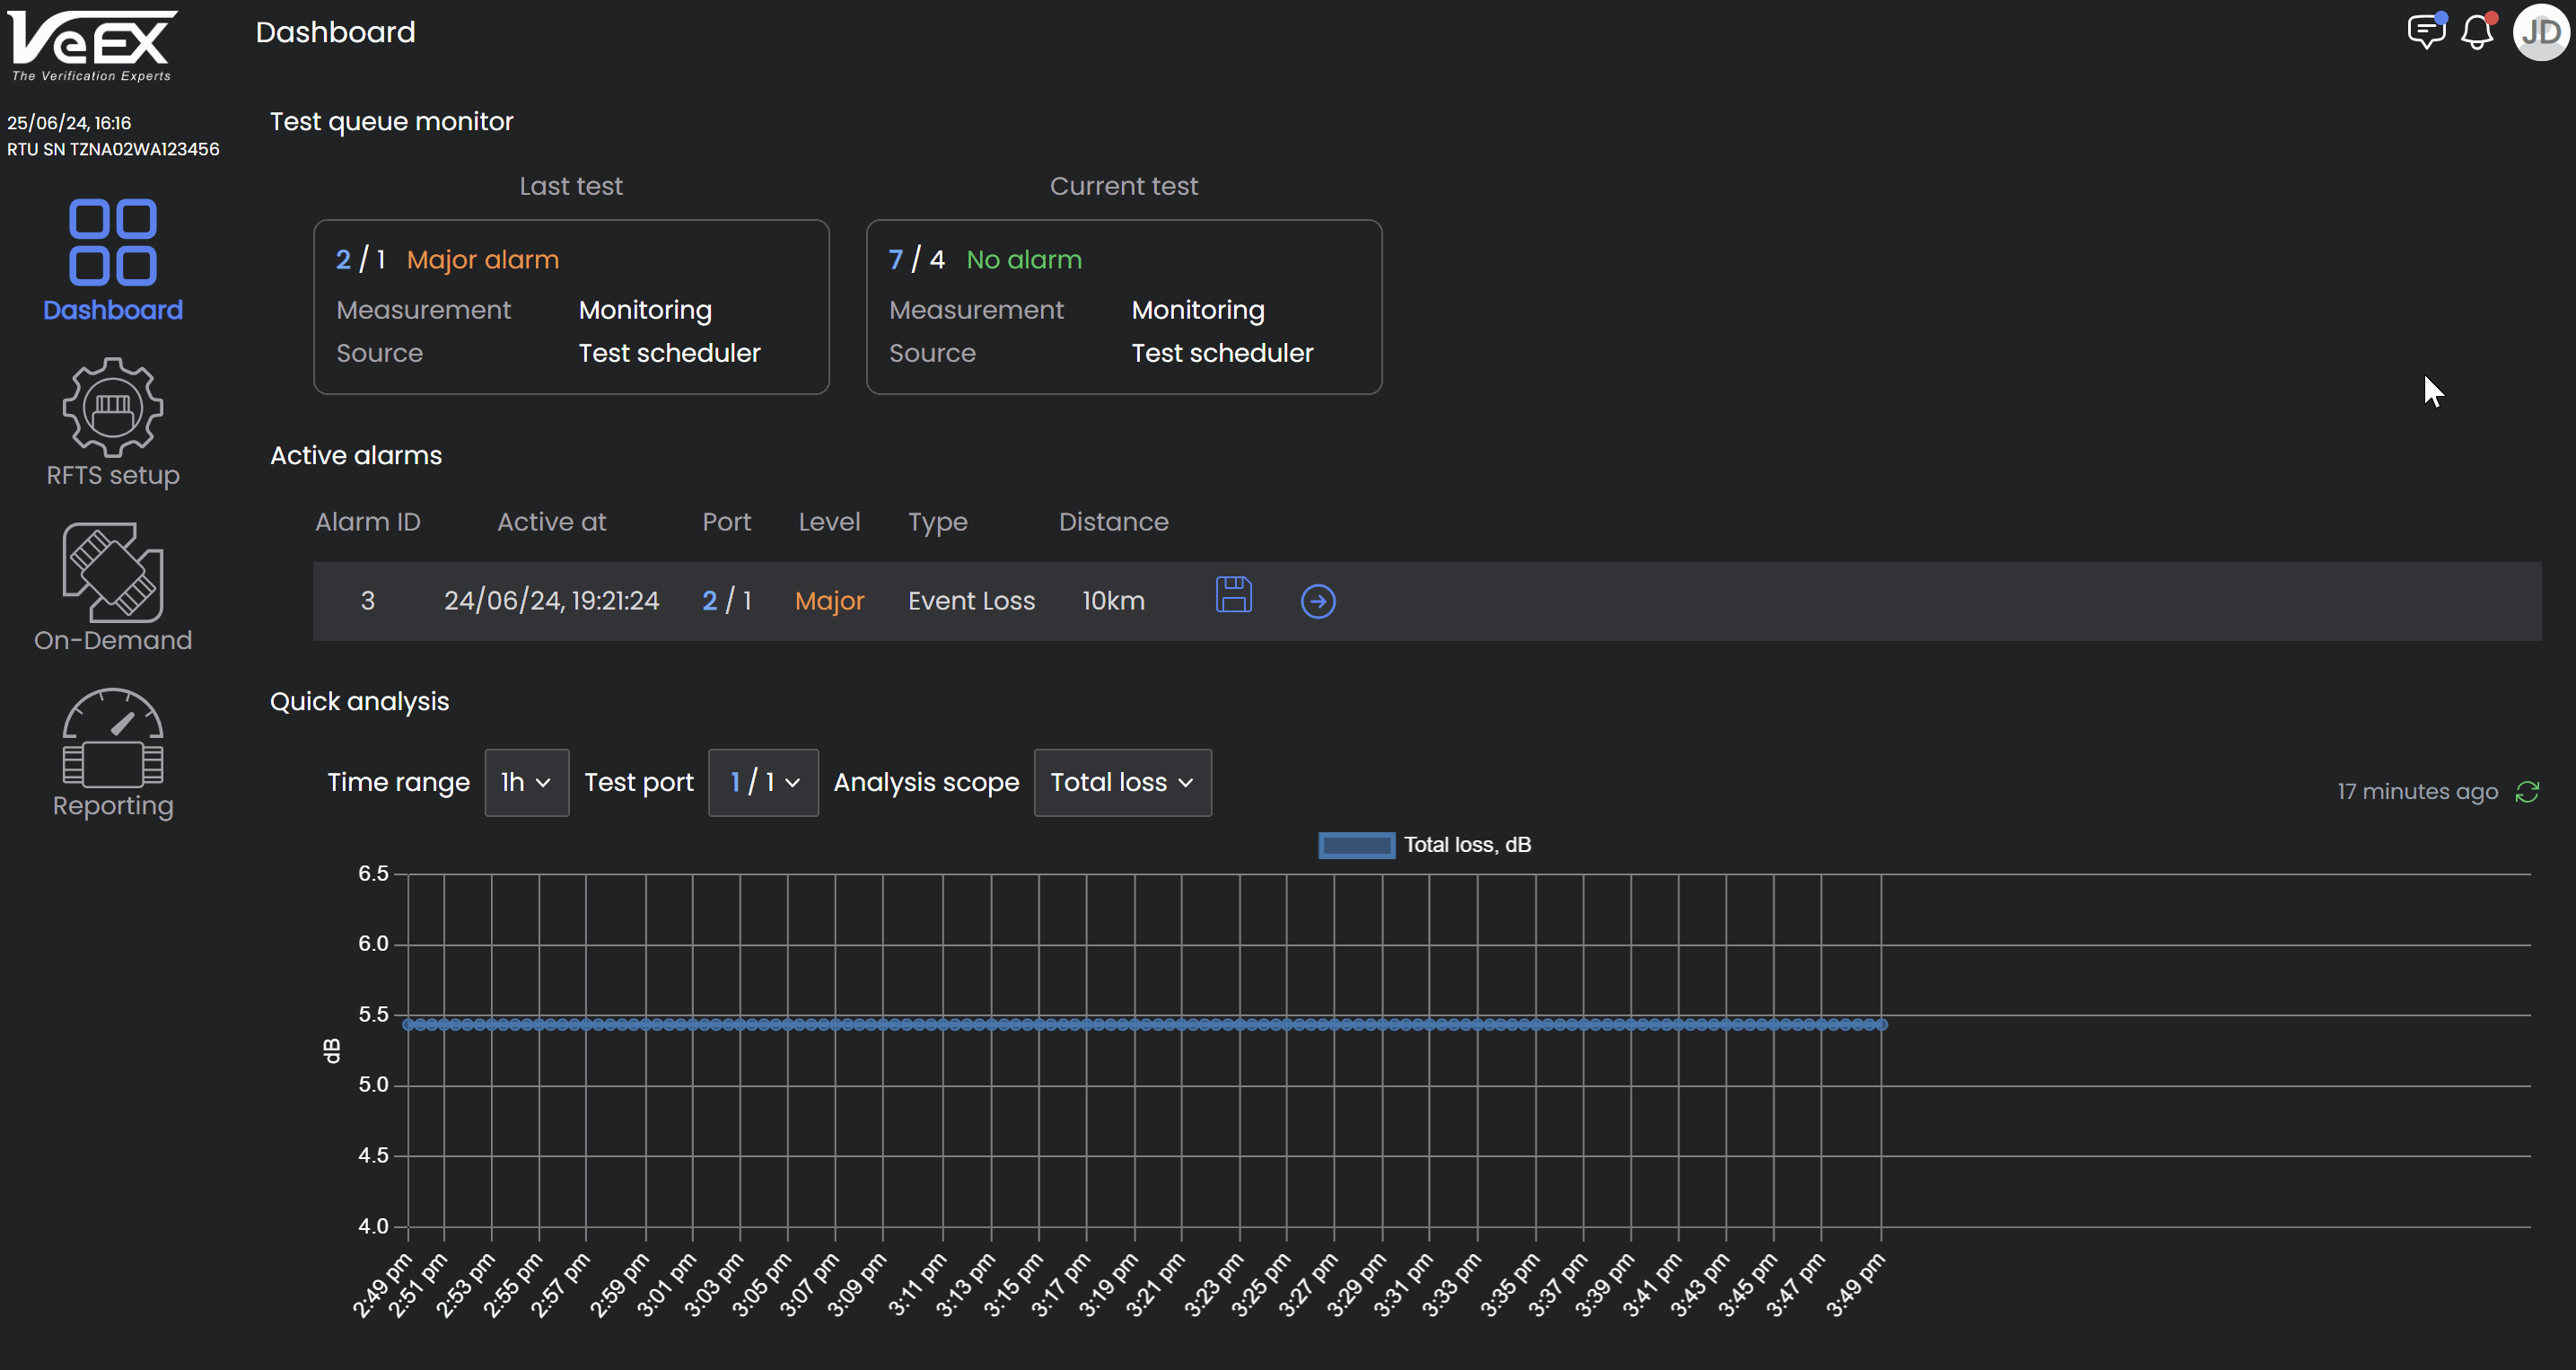
Alarm information shown in the list includes:
-
Alarm ID: Unique identifier for the alarm. Groups alarms that occur at same optical fiber location.
-
Time: Time that the alarm occurred.
-
Date: Date that the event occurred.
-
Port: Control or Switch module and port that the alarm occurred on.
-
Level: Minor, Major, or Critical severity level of alarm triggered.
-
Type: Type of measurement (total loss, event loss).
-
Distance: Location of the event with a visual representation.
-
Active/Resolved: Current or Resolved alarm.
-
Event Location: The fiber location of the event that triggered the alarm relative to the preceding and succeeding events.
Click the arrow next to the fiber location to see the trace that generated the alarm and mark it resolved. See Alarms.
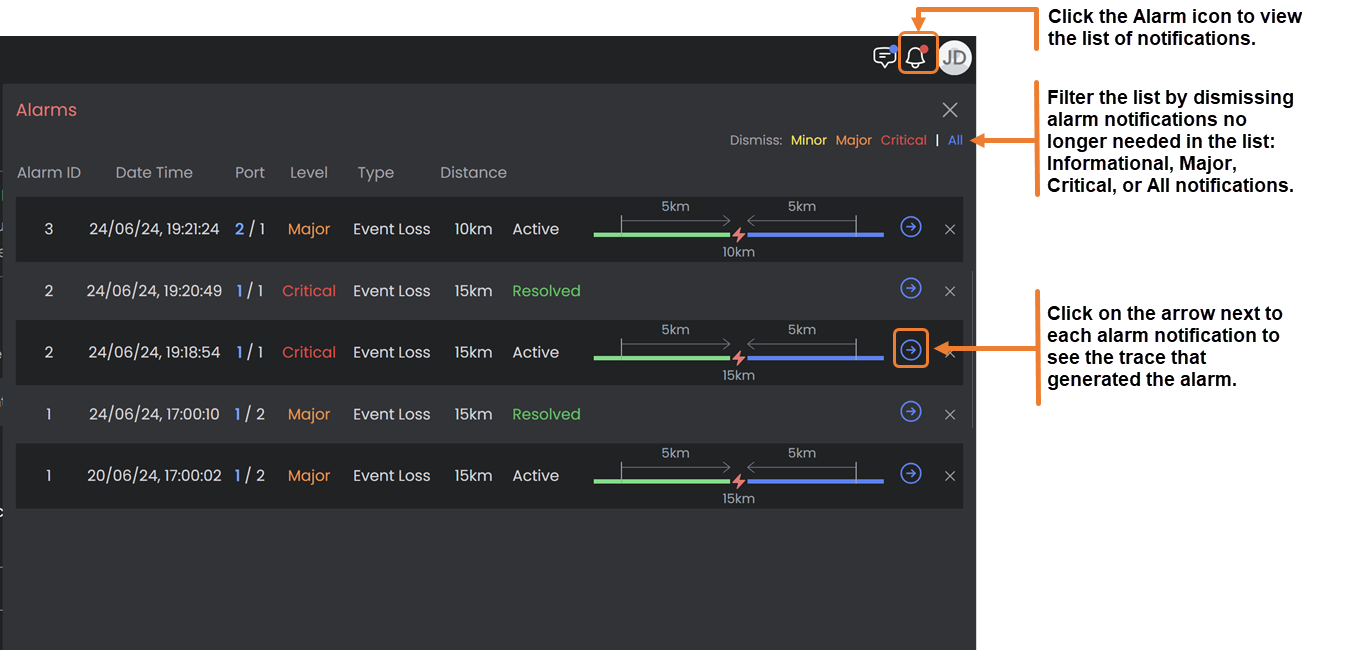
The list can be filtered by dismissing the notifications no longer needed in the list. Selecting the severity level of the notifications to be dismissed:
-
Minor: major alarm triggered.
-
Major: major alarm triggered.
-
Critical: critical alarm triggered.
To clear the list, select All.