Quick Analysis
The Quick analysis is used to analyze and compare loss/reflection, attenuation, or other key performace indicators per individual event or fiber section within the same test port over a pre-defined time interval.
Zooming in to view specific location on fiber section
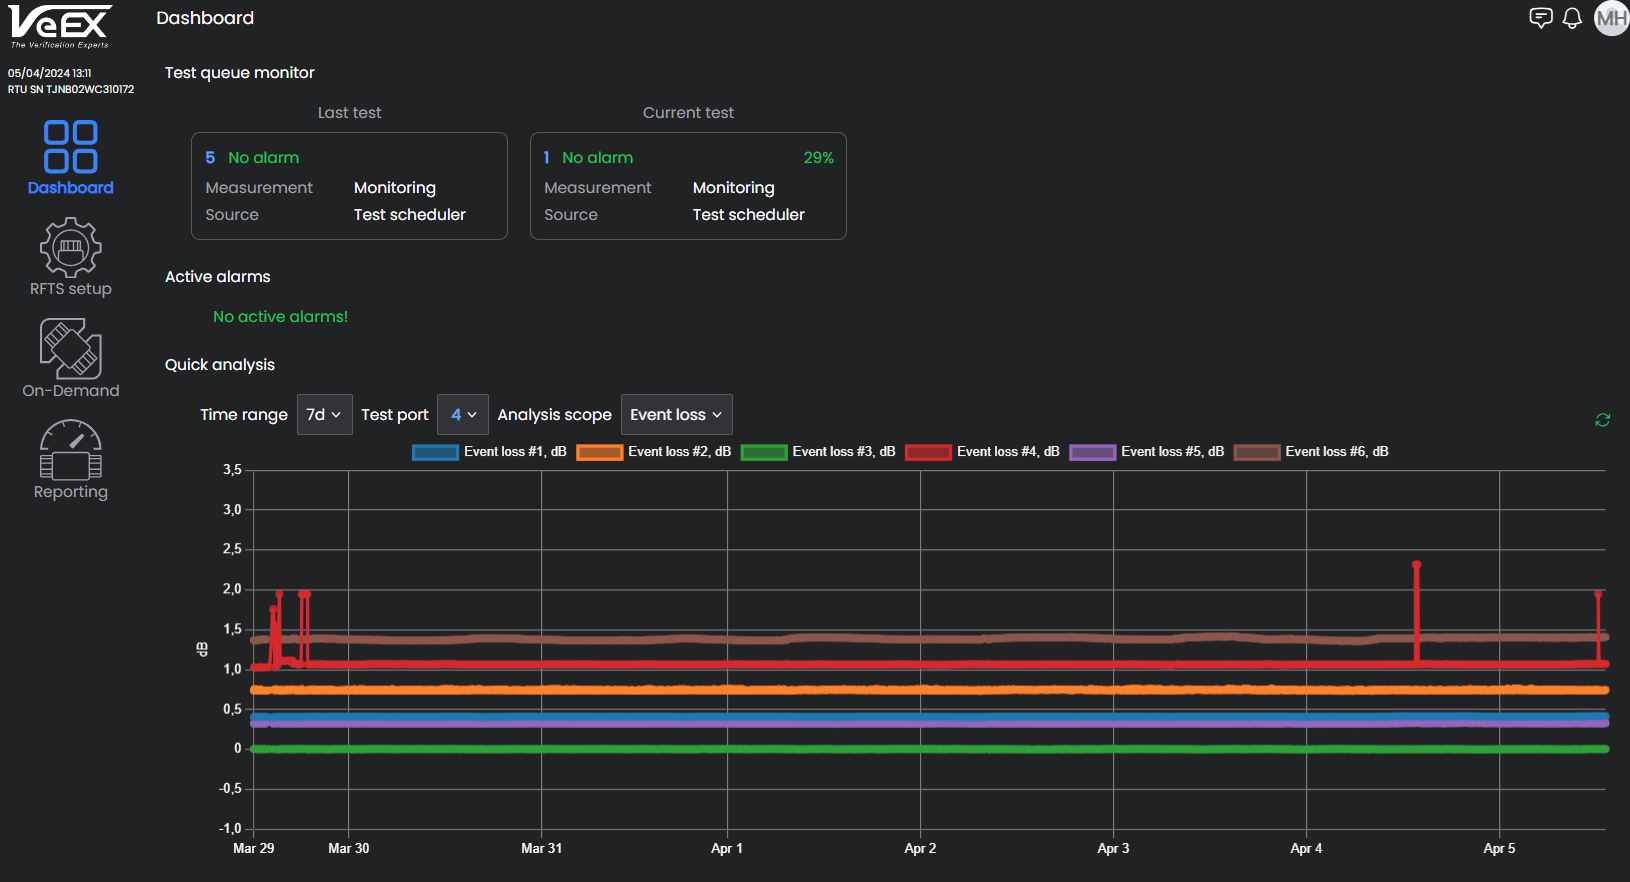
Event Loss Analysis
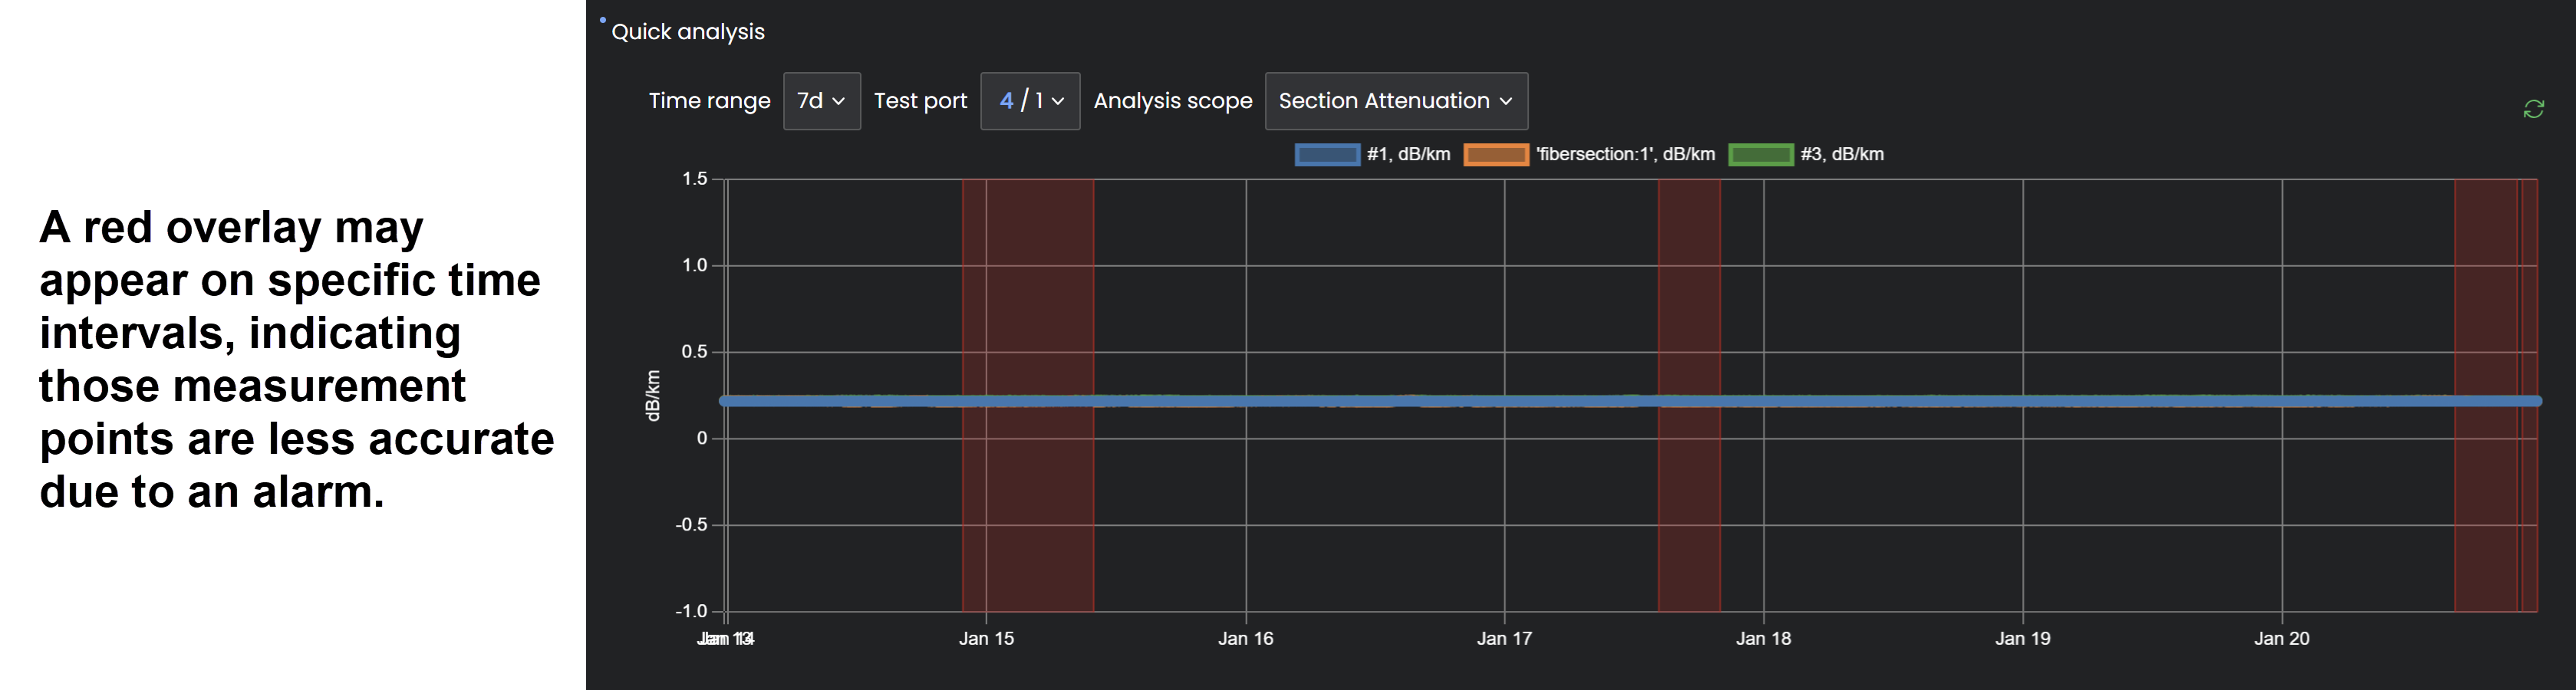
![]() A red overlay on an interval indicates that those measurement points are less accurate due to an alarm.
A red overlay on an interval indicates that those measurement points are less accurate due to an alarm.
Time range
The time range is a pre-defined time span for the trend analysis. Select shorter time ranges to "zoom in" and see individual measurement points. For a more complex view, select longer time ranges. When viewing the time span, consider the monitoring schedule. See Assign Monitoring Cycle.
Test Port
This is the module/port that is being analyzed. See Ports and Monitoring Settings for information on port settings.
Analysis Scope
The Analysis Scope provides a choice of estimated key performance indicators to select and compare over the time range selected. These include:
-
Latency: Time it takes for signal to travel along fiber.
-
Total Loss (dB): Total power loss along the fiber.
-
Total ORL (dB): (Optical Return Loss) The total amount of light being reflected back towards the transmitter source. This includes all backscatter and all reflections. The closer to 0 dB (from a negative number), the worse the connection. Potential causes of high ORL could be fiber breaks or connector issues, such as dirty, cracked, or poorly mated connectors that let in air.
-
Event Loss (dB): A specific point on the FUT that has a sudden drop in power.
-
Event Reflectance (dB): The ratio of light reflected from the backscatter at a specific point on the FUT. The closer to 0 dB (from a negative number), the more poor the connection. Some of the ways to reduce reflectance are to clean and inspect fiber end faces before connecting them and use the appropriate connectors to terminate fiber ends.
-
Section Loss (dB): Power loss along fiber section between events.
-
Section Attenuation (dB/km): Overall amount of light lost along fiber section between events, meaning a reduction in signal power. The greater the attenuation, the more poor quality the fiber and/or connection.
Analyze Trend
Exclude fiber sections from the analysis by clicking them on the legend located right above the graph.
Hover over the graphical trend to see the date/time and measurement details for a specific point on the graph (see below).
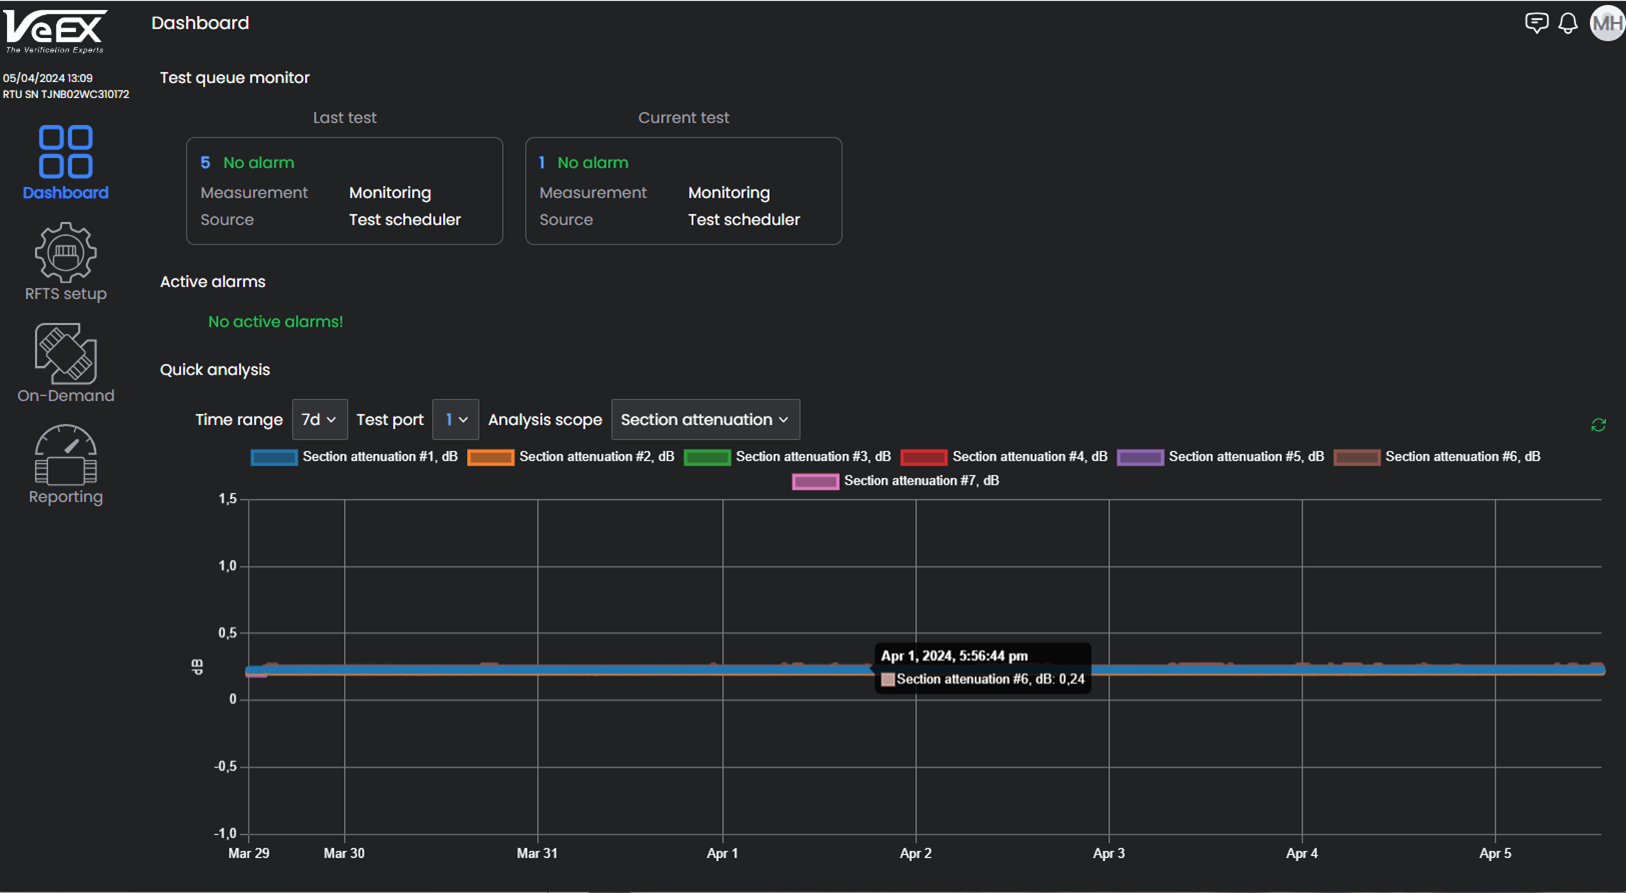
Measurement Points on Attentuation Analysis
Many alarms develop gradually over time due to a weather change excessive attenuation on aerial cables caused by fallen trees, or ice. Select a longer time span to see time intervals where there are alarms and analyze what variables may have caused the alarms on those measurement points (see below).