Trace Analysis
The system analyzes traces automatically, according to the thresholds selected in the alarm profile. OTDR measurement results can be represented in traditional trace and event table, or shown as an event diagram.
A link map is an intuitive link and events representation feature. It identifies events and produces automatic and simplified OTDR analysis in a block diagram.
![]() The combination of V-Scout testing and the link map diagram view of results is especially useful for technicians because it simplifies and accelerates OTDR testing. Refer to V-Scout and Link map.
The combination of V-Scout testing and the link map diagram view of results is especially useful for technicians because it simplifies and accelerates OTDR testing. Refer to V-Scout and Link map.
The cleanest trace is usually a combination of long averaging time, large pulse width, and a low resolution. Using the auto mode setting in the system provides the best possible balance of these parameters when measuring the FUT.
After finishing the analysis, generate a report and/or save the trace .SOR file.
Measure Tab
When a new measurement is started, only those traces will be displayed on the screen in the Measure tab. Any previous traces can be accessed via the Traces tab until the unit is switched off. Refer to Traces Tab.
There are several methods available to manually measure fiber characteristics. Prior to performing manual measurements, it is important to become familiar with the Markers and Zooming capabilities of the unit.
Measure tab
Marker Controls
Markers are provided to measure distances accurately. Depending on the measurement mode and viewing window, one or more markers are available for use. The Markers can be moved using the touchscreen.
The Markers display the following:
- Distance from the start of the trace to Marker "A"
- Distance from the start of the trace to Marker "B"
- Distance between Marker "A" and Marker "B"
![]() As you move the Markers, the distance information updates automatically.
As you move the Markers, the distance information updates automatically.
The active Marker is depicted by two small arrows pointing inwards at the base of the Marker.
The Marker is divided into a thick (bottom) and thin (top) line. To move Marker A or Marker B individually, select and drag the Marker on the thin portion of the marker. To move both Markers together, select and drag any Marker on the thick portion of the line.
If the Markers appear off screen, use the Markers ![]() button on the right side bar to display the Markers on screen.
button on the right side bar to display the Markers on screen.
If a marker is moved too close to another, both will move together to ensure minimal distance between them.
The markers can be moved separately or in tandem (or 5 markers simultaneously in the LSA attenuation measuring mode).
At the top of the screen next to the markers, the position of the marker with respect to the beginning of the optical fiber is indicated in kilometers, miles or feet.
The parameters of the trace corresponding to the markers' position and measurement mode will be displayed at the bottom of the screen.
Zoom/Scroll Controls
Zooming operations are possible in both Events and Measure mode.
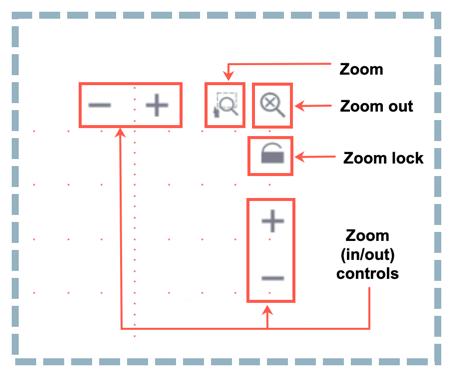
Zoom Operations
- Zoom/Scroll icon - Toggle between and enables Zoom/Scroll mode.
- Zoom mode - Magnifying glass icon appears on screen. Draw a rectangular box over the trace with the stylus to create a zoom area. Visible part of the trace in Preview window is marked with dotted rectangle.
- Scroll mode – Trace can only be scrolled after zooming. After the Hand icon appears on screen, the trace can be dragged in any direction. The mode resets to Zoom immediately after one scroll operation has been completed.
- Zoom Out - Resets display area.
- Zoom Lock - Locks horizontal and vertical controls so zoom aspect is kept uniform.
Distance Measurements
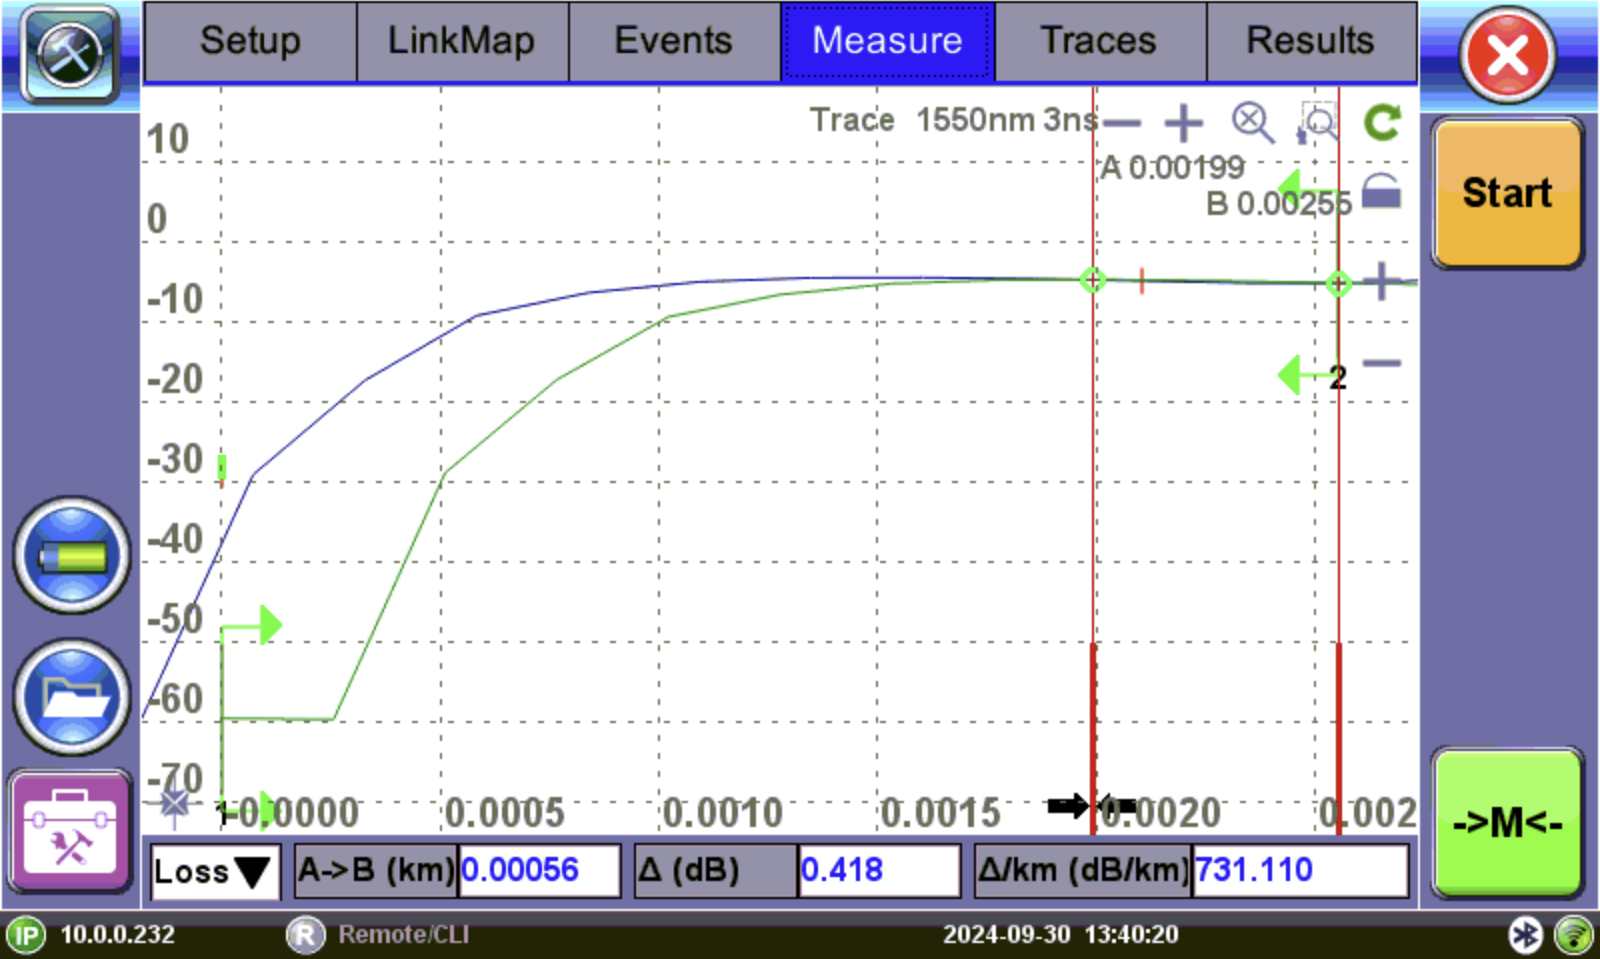
Distance measurement -measure expanded trace view
Tap ![]() in the lower left corner of the graph to display an expanded view. When a trace is displayed as show above, the fiber length is automatically measured from the start of the trace (or Span Begin) to each of the two markers and in between the markers. Proper marker placement is critical for accurate measurements. To position the marker/s accurately, expand the trace horizontally and vertically (using the Zoom Controls) and position the marker on event's left edge (first rising or falling pixel).
in the lower left corner of the graph to display an expanded view. When a trace is displayed as show above, the fiber length is automatically measured from the start of the trace (or Span Begin) to each of the two markers and in between the markers. Proper marker placement is critical for accurate measurements. To position the marker/s accurately, expand the trace horizontally and vertically (using the Zoom Controls) and position the marker on event's left edge (first rising or falling pixel).
The distance (km, miles or feet) will be indicated next to the top of the marker.
![]() The distance accuracy depends on the correctness of optical fiber refraction index value setting.
The distance accuracy depends on the correctness of optical fiber refraction index value setting.
Loss Measurements
Loss Modes - Several Loss modes are available for manual measurements depending on measurement application:
- 2-Pt Loss
- 2-Pt LSA
Two Point Loss measurement
- Reflectance
- ORL (Optical Return Loss)
- Splice Loss
|
|
Good Measurement Tips
|
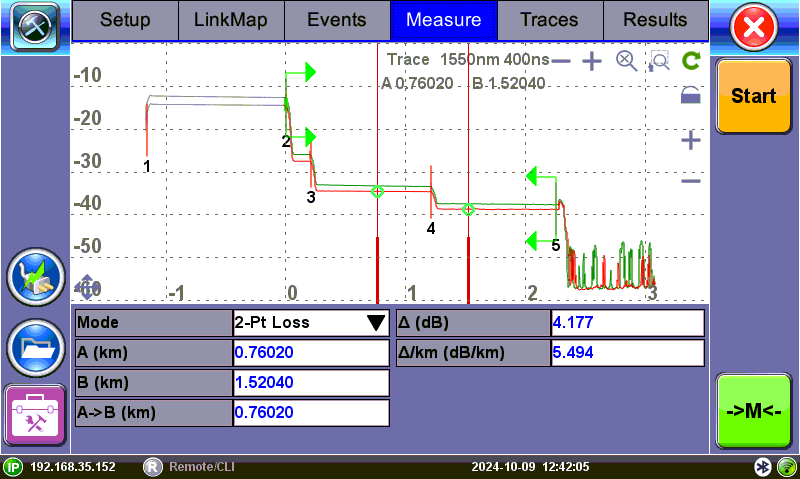
Two Point Loss (2-Pt Loss)
The 2-Point Loss mode is the default view. It uses a data point at Marker A and Marker B to calculate the dB level difference between the two points. Usually the backscatter level value of Marker A is greater than the level of Marker B and a positive loss measurement is displayed. If the loss value is reported as a negative quantity, it is termed a "gainer".
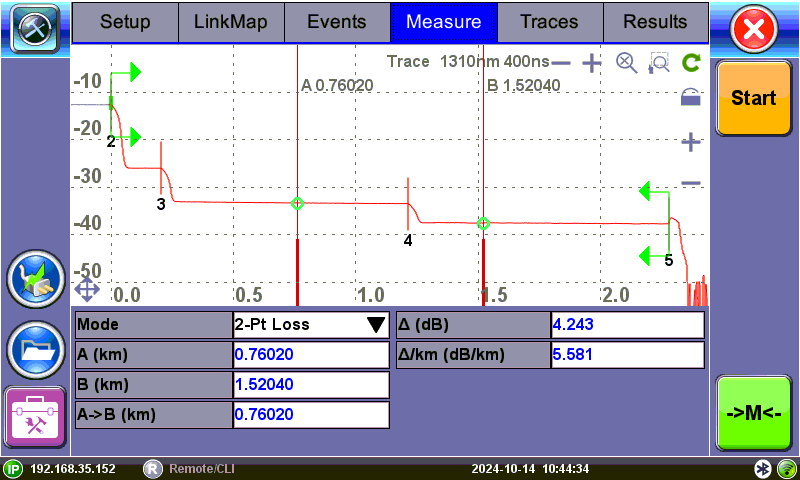
2-Pt Loss measurement
The data at the bottom of the screen displays:
- Distance between markers A-B
- Loss between markers A-B in dB
- Attenuation between markers A-B
Two Point LSA (2-Pt LSA)
To increase the accuracy of a loss or attenuation measurement, a section of the trace preceding and following the marker A and marker B can be approximated by a straight line. In this mode, a Least Squares Approximation technique is used to determine the best intercept values based on the marker positions. The length of these LSA sections is user selectable.
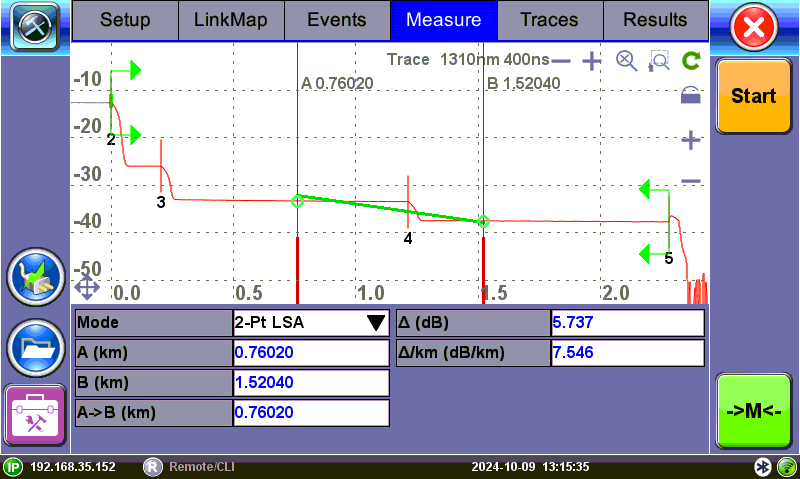
Splice Loss using 2-Point LSA method
Select LSA from drop-down list. An approximation line will appear on the screen between markers. The data box at the bottom displays:
- Distance between marker A and B (km, miles, feet)
- Level difference in dB
- Attenuation based loss/distance
|
|
Splice Loss Measurement (5-Marker technique)
To measure the loss of a splice or a connector, the 5-marker technique is recommended. The system calculates loss by looking at the fiber traces on each side of the event, instead of using fiber length as a factor. It uses the advanced Least Square Approximation (LSA) as a default, to mitigate noise. To use LSA, set markers at each end of the fiber segment, one marker on the peak, and two markers near the event.
5-marker technique (simplified view
Marker placement for a connector (simplified view)
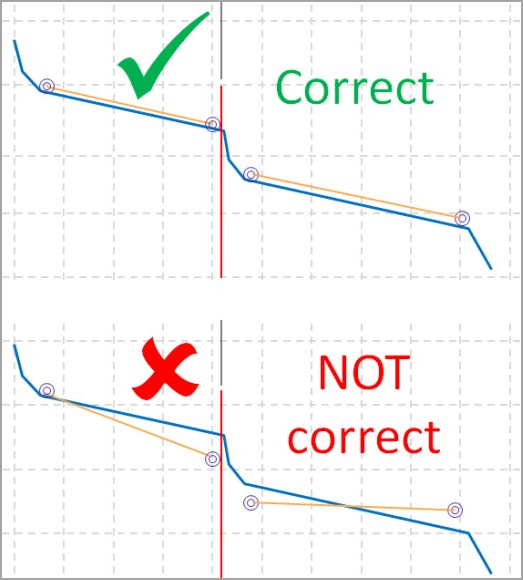
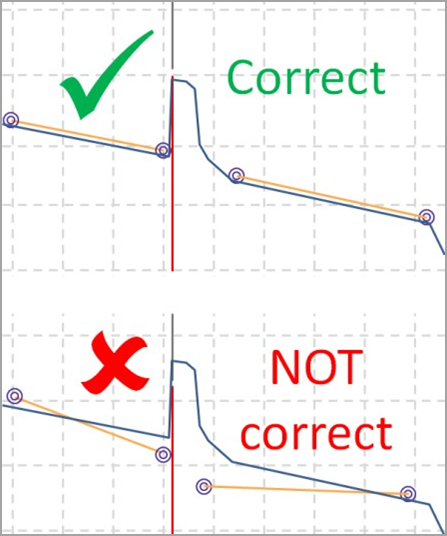
To manually apply the markers, select the longest straight sections and approximate the fiber under test as closely as possible. Avoid sections where the trace is rounded. Keep the lines strictly on the backscatter, even if it is noisy. The central marker must be placed at the very beginning of the event (see the example below).
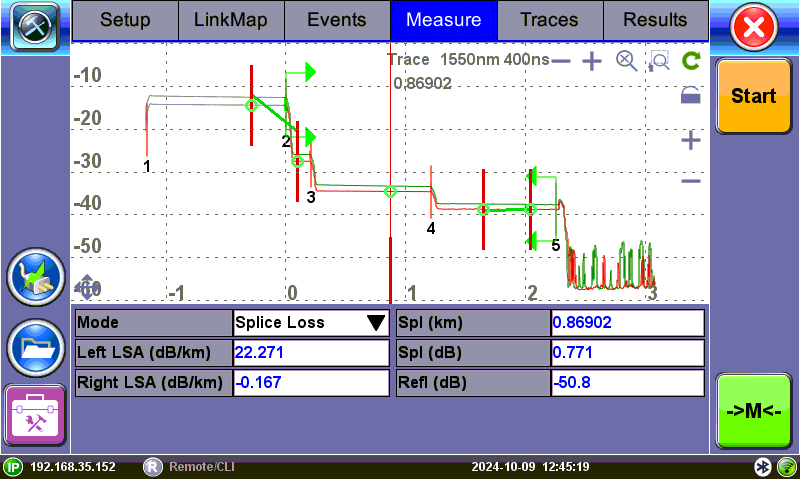
Splice Loss using 5-Point LSA method
To view the Splice Loss:
- Select trace for measurement (if multiple traces are displayed on screen). The trace to be measured can be selected using the green arrow in the trace overview window.
- Select Splice Loss from drop-down list.
- Expand or zoom the trace horizontally and vertically (using Zoom Controls) and position event in the middle of the screen using the scroll function. Always ensure that a part of the trace is visible on either side of the event so you can place markers properly.
- Position center marker on the event's rising or falling edge. You can use the rubber keypad to place the marker exactly, if needed.
- Position the first two LSA interval indicators on a linear section of backscatter preceding the event and position the last two LSA indicators after the event, ensuring that only pre/post backscatter is used to make the measurement. The entire event including transition should not be included in either LSA intervals.
 All four LSA interval indicators can be positioned independently in relation to the center Marker. When the center Marker is moved, the intervals will move simultaneously to maintain relative.
The sections between the first two markers and the last two markers are approximated by straight lines (LSA). The value of event loss is defined by the position of the center marker.
The bottom of the screen displays:
- Spl (km, meters, miles or feet) - distance of center marker
- Loss of the event in dB based on the pre/post LSA sections and center marker
- Reflectance in dB if event is reflective
Reflectance Measurement
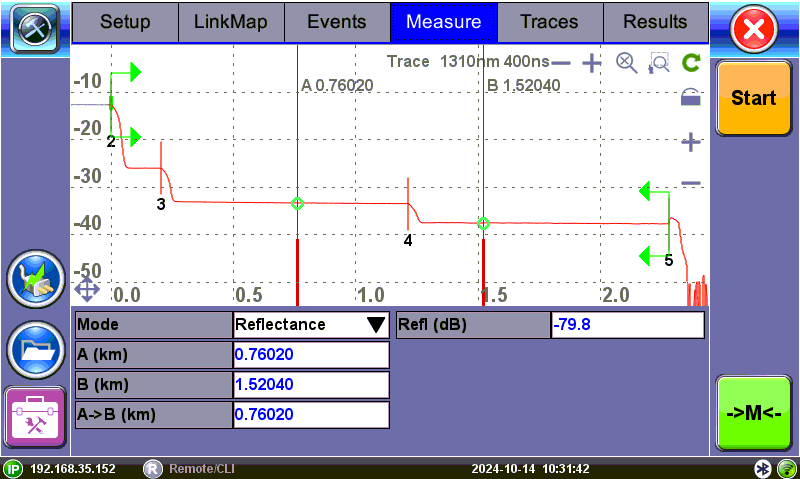
Reflectance measurement
Reflectance is measured in -dB (negative decibels). A smaller negative value (-65dB) indicates a smaller reflection whereas a larger negative value (-45dB) indicates a larger reflection. Larger reflectance will appear as a higher spike or peak on the trace and shorter EDZ measurement.
To view the Reflectance:
- Select trace for measurement (if multiple traces are displayed on screen). The trace to be measured can be selected using the green arrow in the trace overview window.
- Select Reflectance from the drop-down list at the bottom of the screen.
- Expand the trace horizontally and vertically (using Zoom Controls) to display the reflection correctly. The entire reflection will be displayed including a small section of the trace preceding and following the event.
- Place the left marker on the base of the event's rising edge. The right marker is placed on the peak of the reflection or after the peak. The software will look for peak value.
The bottom of the screen displays:
- Distance of A cursor (reflection) from Start of test fiber
- Distance of B cursor (top of reflection) from Start of test fiber
- Distance between markers A->B
- Reflection for this even (-dB)
ORL Measurement
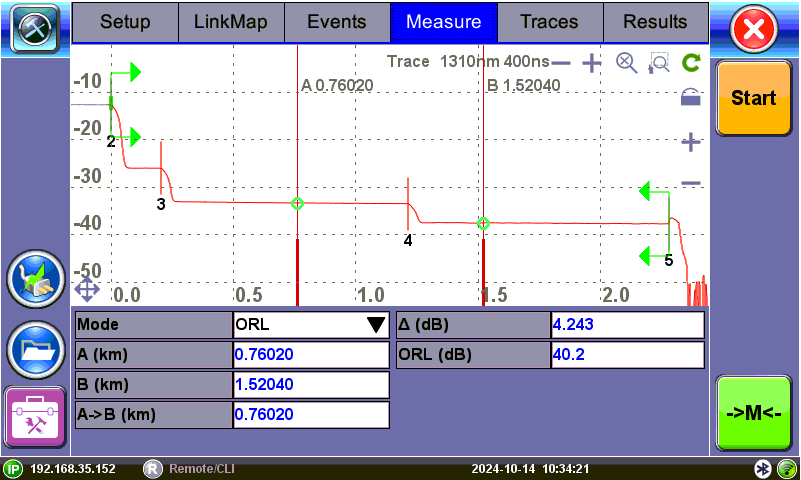
ORL measurement
ORL is the total amount of light being reflected back towards the transmitter or source. This includes all backscatter and all reflections.
To calculate ORL:
- Select the trace for measurement (if multiple traces are displayed on screen). The trace to be measured can be selected using the green arrow in the trace overview window.
- Select ORL from the drop-down list.
- Place marker A at the beginning of the fiber under test and marker B at the end of the fiber span under measurement (just before end reflection, if available). Moving marker B beyond the end will not change the span ORL; moving marker B to less than the end will result in a change in ORL.
The bottom of the screen displays:
- Distance to A cursor
- Distance to B cursor
- Distance between markers A-B
- Loss between the markers A-B (dB)
- Optical Return Loss (ORL), dB