OTDR Screen Navigation
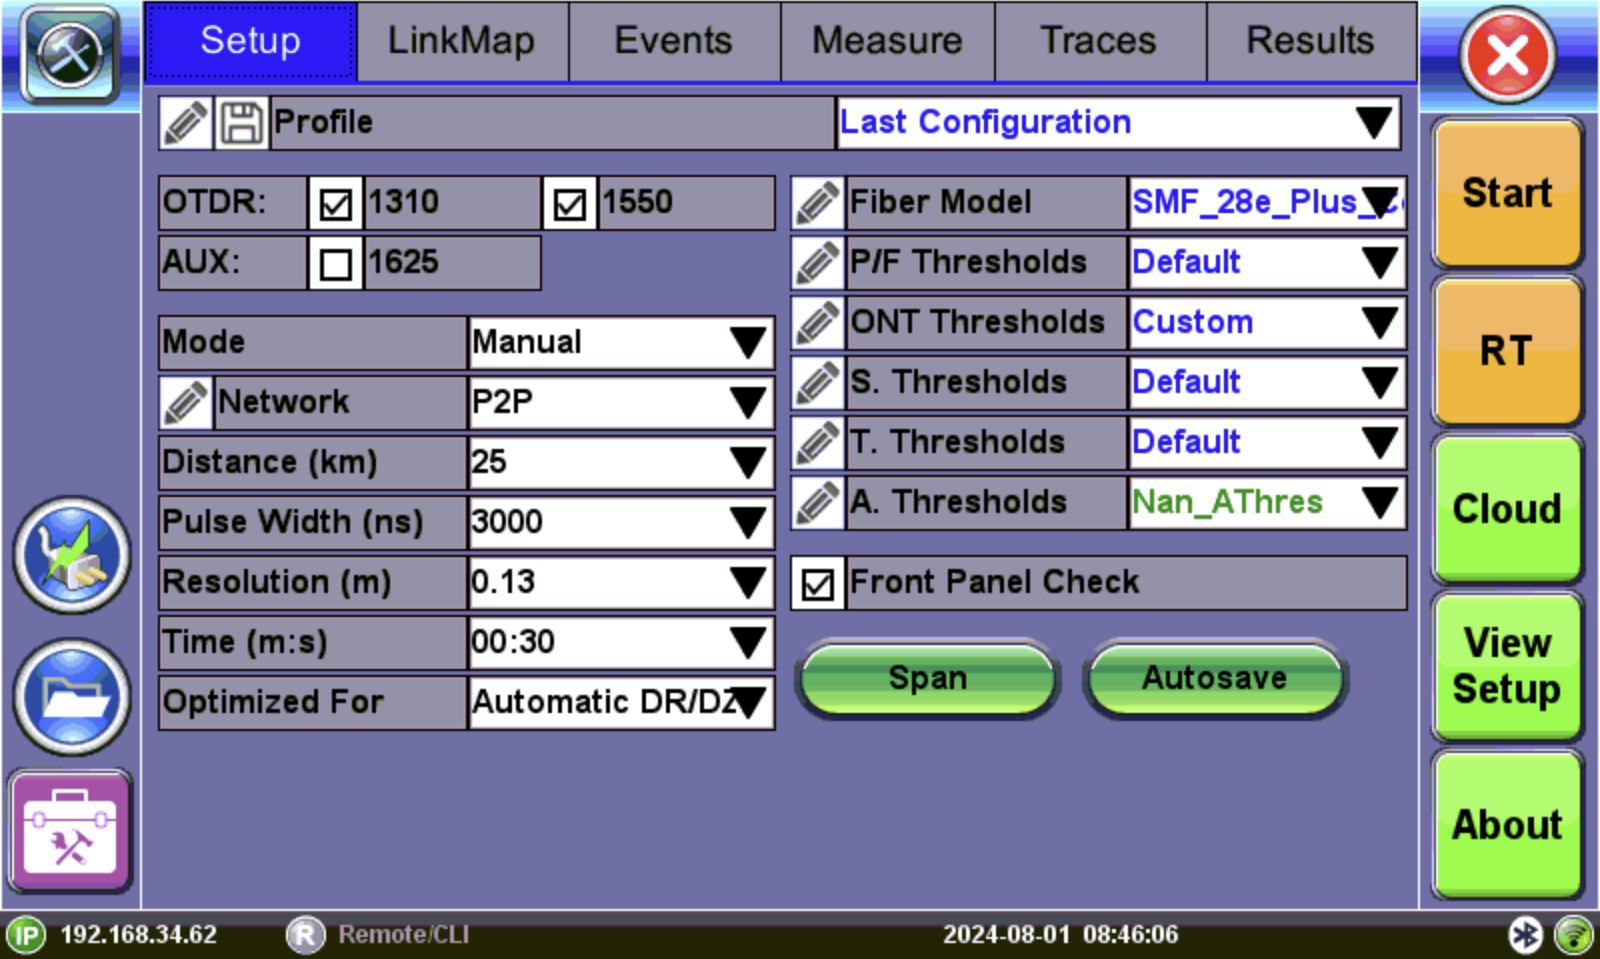
OTDR Screen
Use the top tabs to access test measurement controls and view results.
The bottom bar displays:
- IP address, when connected
- Remote control connection status
- Date and time
- Bluetooth and Wi-Fi network connection indicators
Icon Descriptions
|
|
Escape/Exit: Tap to close the Fiber test application and return to the Main Fiber Menu. |
|
|
Start: Begin trace. |
|
|
RT: Real Time OTDR - See trace in real time. If button isn't on interface, turn on by selecting View Setup. |
|
|
Cloud: Connects to cloud storage. |
|
|
|
|
|
About: Shows software version and options to setup as server. |
|
|
Autosave: Settings so results that are saved automatically contain default information in the filename. |
|
|
Span: Settings for the offset length of an external launch fiber or patchcord connected to the fiber under test so that it does not become part of the fiber span and analysis. |
|
|
Application Tools: Access applications, depending on the test set and options purchased i.e. OTDR, Flow®, OLTS, etc. |
|
|
Fiber Scope – Shortcut key to access Fiber Scope, accessible from the Test Applications Toolbox menu. |
|
|
OLS/OPM: Launches the |
|
|
PFP Power Splitter: Launches the PFP Power Splitter application, accessible from the Test Applications Toolbox menu. |
|
|
OTDR : |
|
|
Flow®: Launches Flow® application, accessible from the Test Applications Toolbox menu. Saves a series of tests and compiles them into a full Flow® Test Report. |