Reference Baselines
Each active monitoring port requires a unique signal reference baseline to be measured and saved. This saved baseline will be used to report an out of limits condition properly. Prior to acquiring a new baseline, configure the port and threshold limits.
Baselines are set on the Port Dashboard ![]() >
>![]() >
>![]() .
.
Use the default Alarm Profile already configured or set up an Alarm Profile, if needed. Refer to Alarm Profiles and Thresholds .
![]() The RFTS-400 features multi-tasking support. There is no need to wait for the baseline test to finish. After starting the test, move on to other tasks within the system. It sends a notification once the test is complete. Baselines can be run on more than one port in parallel.
The RFTS-400 features multi-tasking support. There is no need to wait for the baseline test to finish. After starting the test, move on to other tasks within the system. It sends a notification once the test is complete. Baselines can be run on more than one port in parallel.
![]() Expand: Select to hide the setup options and maximize the viewable area of the trace.
Expand: Select to hide the setup options and maximize the viewable area of the trace.
![]() Minimize: Select to unhide the set up options.
Minimize: Select to unhide the set up options.
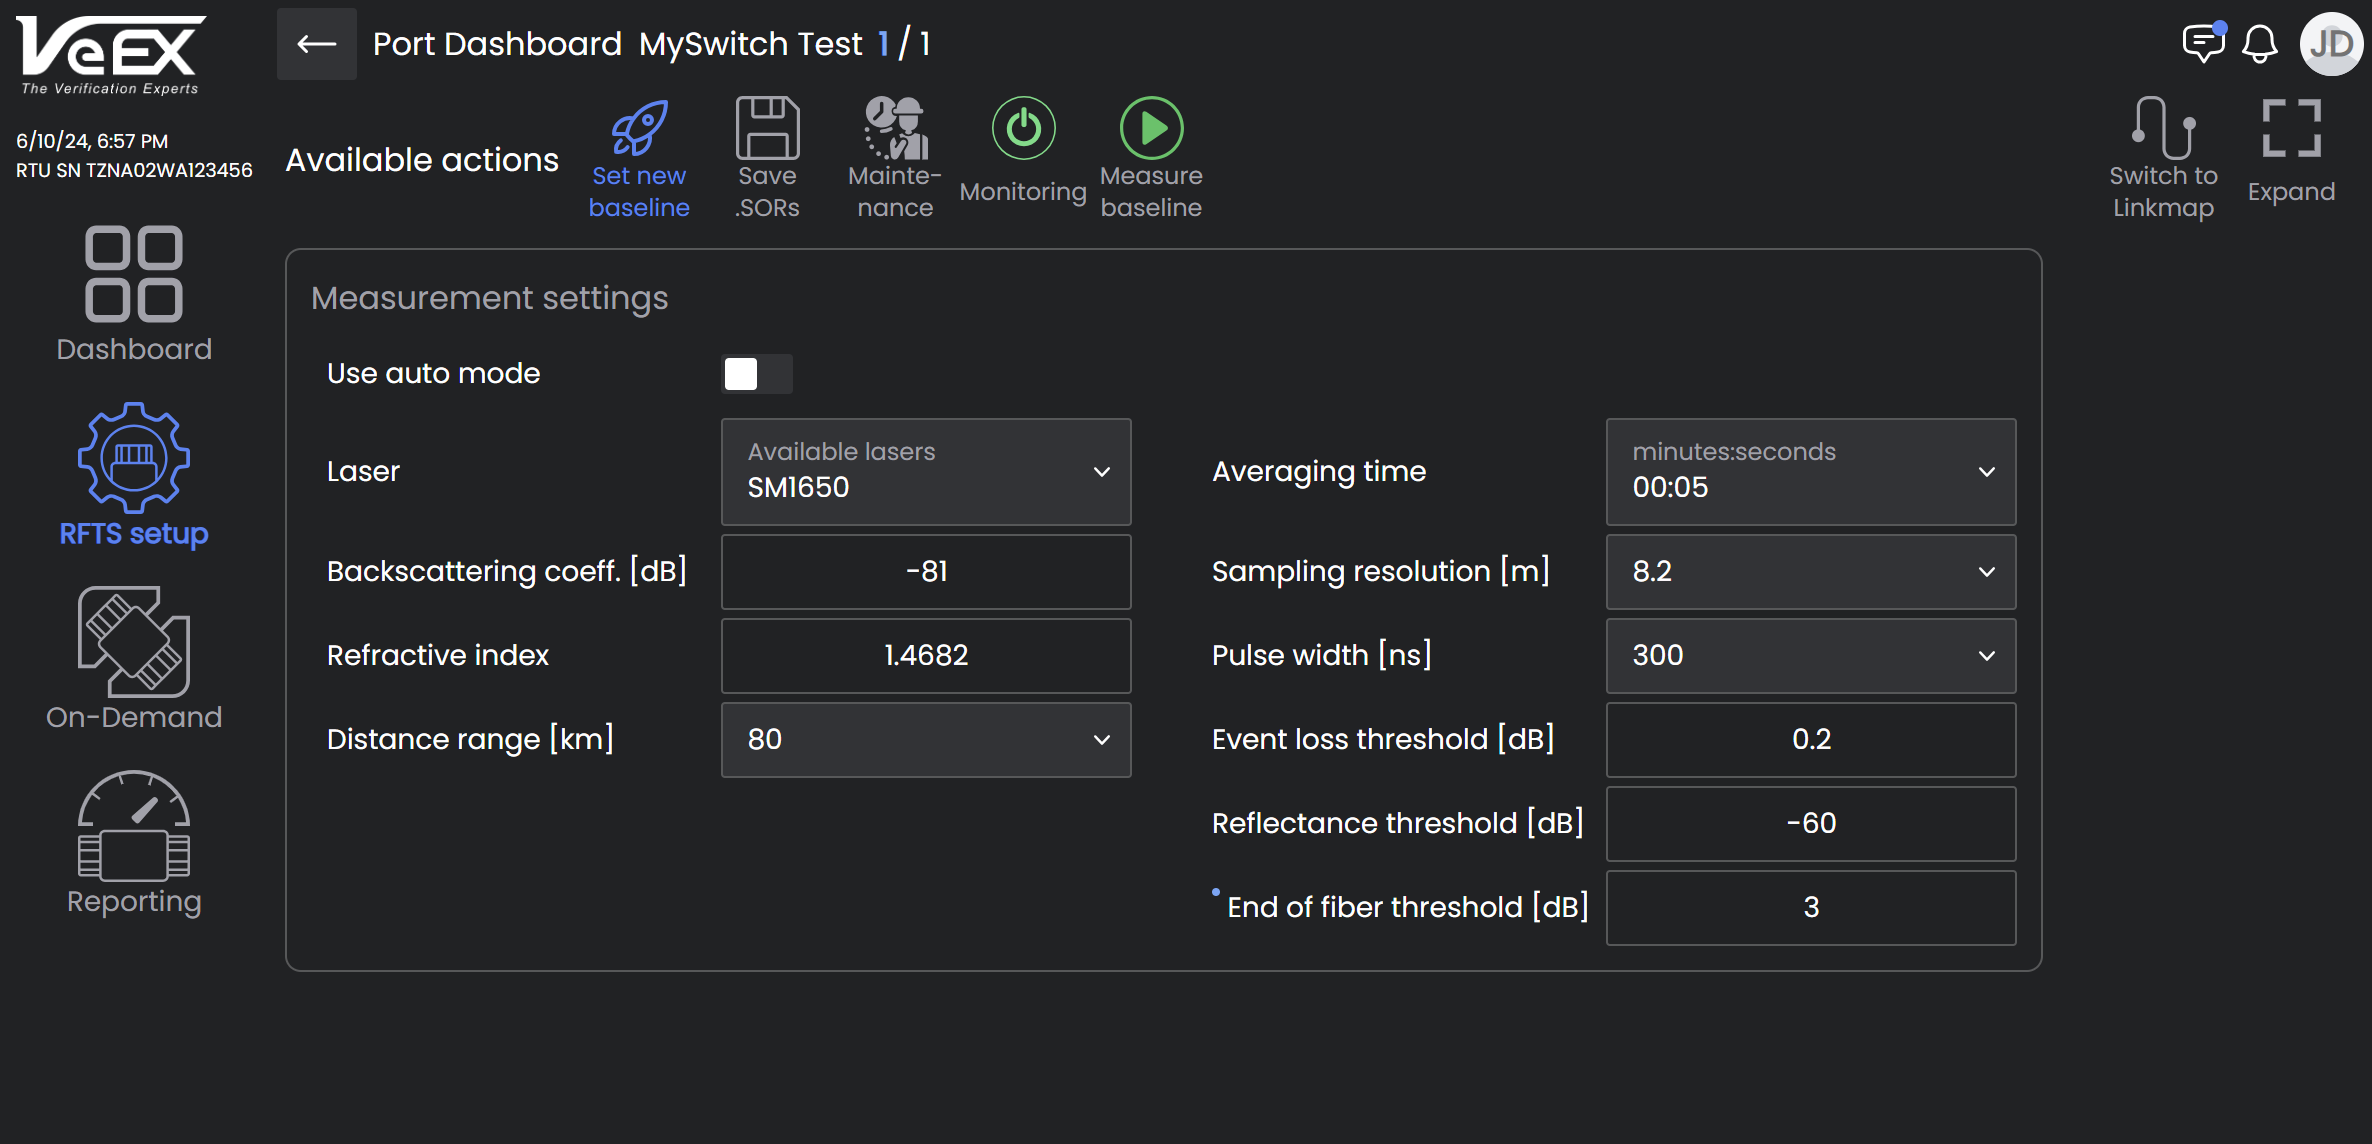
Baseline Setup - Manual Mode
Measurement Settings
-
Auto mode: Click to move slider to the right which selects Auto mode. Leave Auto mode OFF (slider to the left) for Manual mode. In Auto mode, single pulse per wavelength is used. Use Auto for the system to perform a measurement and analysis of the fiber and determine optimal test settings automatically. Manual mode is for more skilled OTDR users to configure OTDR parameters and achieve a more specific alarm performance.
-
Laser: Select the available OTDR wavelength. In-service filtered testing at 1625nm or 1650nm. Dark fiber monitoring at 1550nm, 1625nm, or 1650nm.
-
Backscattering coeff. [dB]: Enter the level of backscattering in a particular fiber (-90 dB to -50 dB). It is used for Reflectance and ORL measurements and can be obtained from the fiber manufacturer.
-
Refractive index]: Enter the IOR (refractive index) for each available wavelength (1.2 dB to 2 dB). It is used to convert time to distance. Setting a proper value determines accurate distance measurement.
-
Distance range [km]: (manual mode only) Select the maximum value of measured distances; the value of distance range should exceed the expected length of the FUT by at least 20%.
-
Averaging time [minutes:seconds]: (manual mode only) Select the duration of the measurement process with averaging. Longer averaging time improves the SNR and produces a "smoother" trace.
-
Sampling resolution [m]: (manual mode only) Select the distance between two data points (sampling interval) of the trace; values depend on the selected distance range. Select the smallest value to measure events spaced close together. Select the largest value for longer ranges. Auto mode will determine best value for the FUT.
-
Pulse width [ns]: (manual mode only) Select the value of the optical pulse duration. Short pulse widths provide better resolution and produce the best event and attenuation dead zones. Short pulse widths, however, inject less optical energy into the Fiber-Under-Test (FUT), resulting in a noisier trace and lower dynamic range. Longer pulse widths provide the highest dynamic range and are used to test long fibers.
-
Event loss threshold [dB]: Enter the lowest event loss value that will be reported by the analysis. The setting range for this parameter is 0.05 dB to 30 dB in 0.01 dB increments. The default value is 0.03 dB. That means that all the events in the trace with loss ≥ 0.3dB and reflectance ≤ reflectance threshold will show in the event table as loss events. If the event reflectance is higher than the reflectance threshold then the event will be shown as a reflective event.
-
Reflectance threshold [dB]: Enter the lowest Reflectance value that will be reported by the analysis. The setting range for this parameter is -65.0 dB to -14.0 dB in 0.1 dB increments. The default value is -60.0 dB.
-
End of fiber threshold [dB]: Mouse over the field label for a hint on how to configure this setting. Enter the threshold value to detect the end of fiber event. The setting range for this parameter is 1 dB to 50 dB in 1 dB increments. The default value is set to 3 dB (recommended for non-PON span). The first event in the .sor file with the loss bigger than the configured threshold will be considered as the end of fiber.
Measure a Baseline
-
On the Port screen
 >
> >
> , ensure the correct Alarm Profile is assigned to the port in the Alarm Profile column. Click the field to access the drop-down menu and select the correct profile, if needed.
 -
On the Port Dashboard
>> , turn off Maintenance mode by selecting Maintenance at the top of the screen. When turned off, the icon turns orange and the Port status switches to Maintenance.
 -
At the top of the screen, select Set New Baseline
 .
. -
Enter the Measurement Settings and select Measure Baseline
 . To stop the baseline measurement in progress, select Stop test
  . After the baseline is finished, a message in red appears on the right "OTAU port is in Maintenance mode".
 -
Turn on Maintenance mode by selecting Maintenance at the top of the screen. The Port status switches to On to indicate active monitoring.
Reference Baselines should be remeasured in the following circumstances:
-
When a new alarm profile is assigned to a port.
-
When thresholds are changed in the alarm profile or the alarm profile is otherwise changed.
-
After equipment maintenance, redo to ensure the levels are correct even if the signal level is not supposed to have been impacted by the maintenance.