Port Dashboard
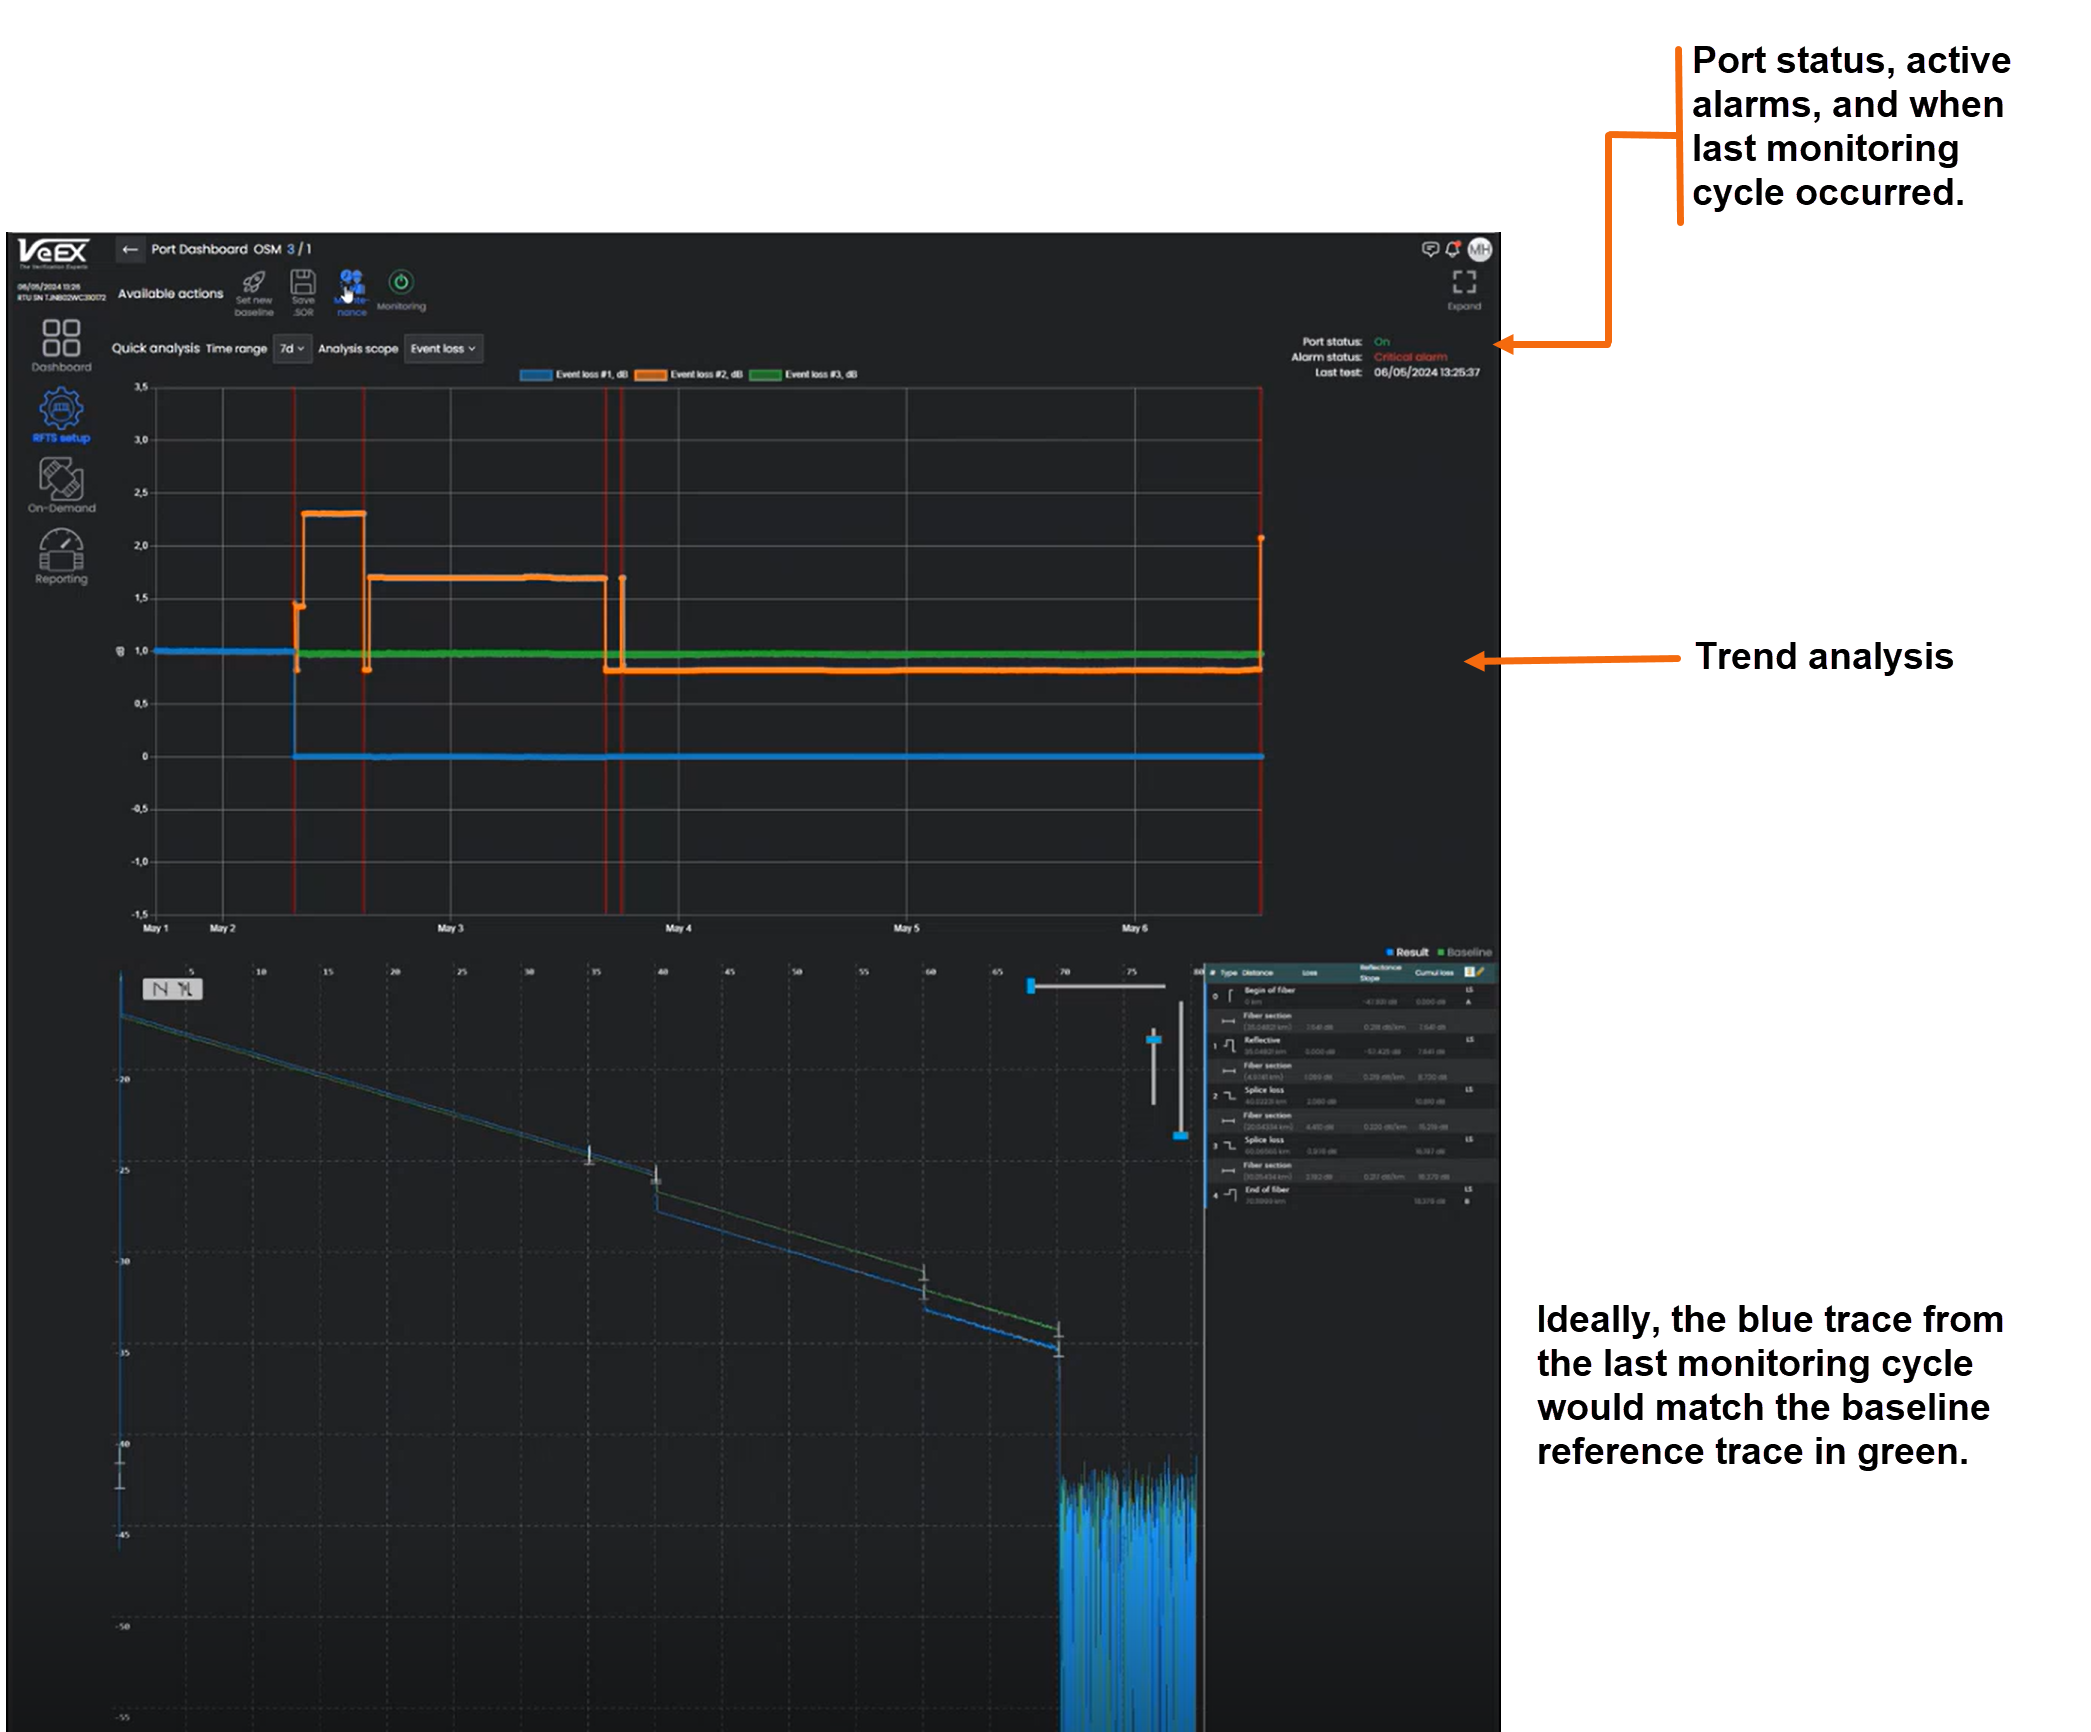
The Port Dashboard to displays the quick trend analysis and trace from the last monitoring cycle.
On the upper right of the screen, the current port status, active alarms, and time of last monitoring cycle are displayed.
![]() Switch to Link map: Select to hide the trace at the bottom and view the link map of events.
Switch to Link map: Select to hide the trace at the bottom and view the link map of events.
![]() Switch to OTDR: Select to go back to the trace display.
Switch to OTDR: Select to go back to the trace display.
![]() Switch to GIS: Select to hide the analysis at the top of the screen and view the GIS Route Map.
Switch to GIS: Select to hide the analysis at the top of the screen and view the GIS Route Map.
![]() Switch to dashboard: Select to go back to the analysis and trace display.
Switch to dashboard: Select to go back to the analysis and trace display.
![]()
![]() Expand/Minimize: Select to expand the trace or link map at the trace at the bottom of the screen.
Expand/Minimize: Select to expand the trace or link map at the trace at the bottom of the screen.
Trend Analysis
For more information on Trend analysis, see Quick Analysis.
GIS
For more information on GIS fiber route maps, see GIS Management.
OTDR Trace
The trace appears at the bottom of the screen. The reference baseline appears in green. The current trace appears in blue. Ideally, the current trace from the last monitoring cycle would match the baseline. When the event or trace parameter exceeds the minimum threshold, it appears in red.
ALM LEDs (Alarm Indicators)
![]() Solid Green: There are no active monitoring alarms.
Solid Green: There are no active monitoring alarms.
![]() Solid Red: There are one or more active monitoring alarms. Review the monitoring log for further details.
Solid Red: There are one or more active monitoring alarms. Review the monitoring log for further details.
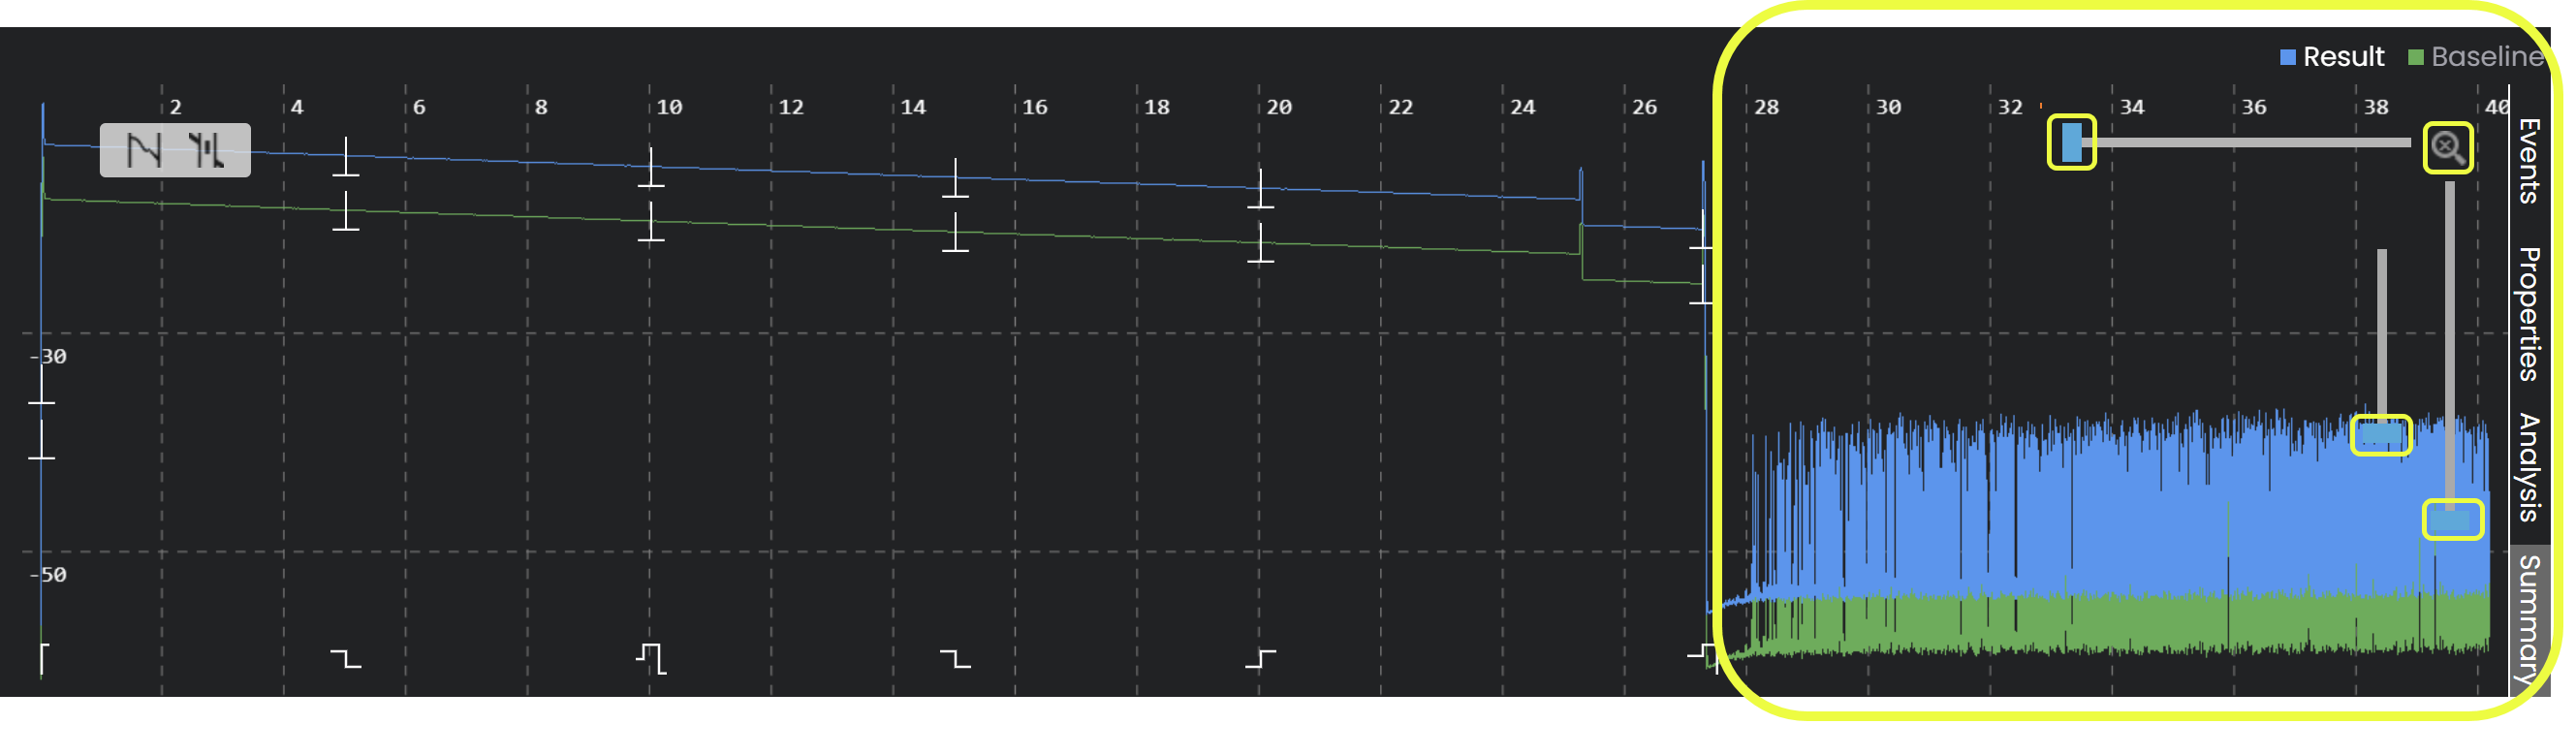
When previewing a measurement result or a report, change the trace scale by moving the sliders at the top right corner (highlighted in the Figure below on the right), separate for vertical and horizontal scaling. To return to 100% view, click the magnifying glass icon (![]() ).
).
Changing the Trace Preview Scale
Trace Parameters (Events, Properties, Analysis, Summary)
Click one of the tabs on the right of the trace preview (see previous Figure) to see the trace parameters. The parameters are grouped into several tabs. Once selected, the tabs move to the bottom of the parameters box.
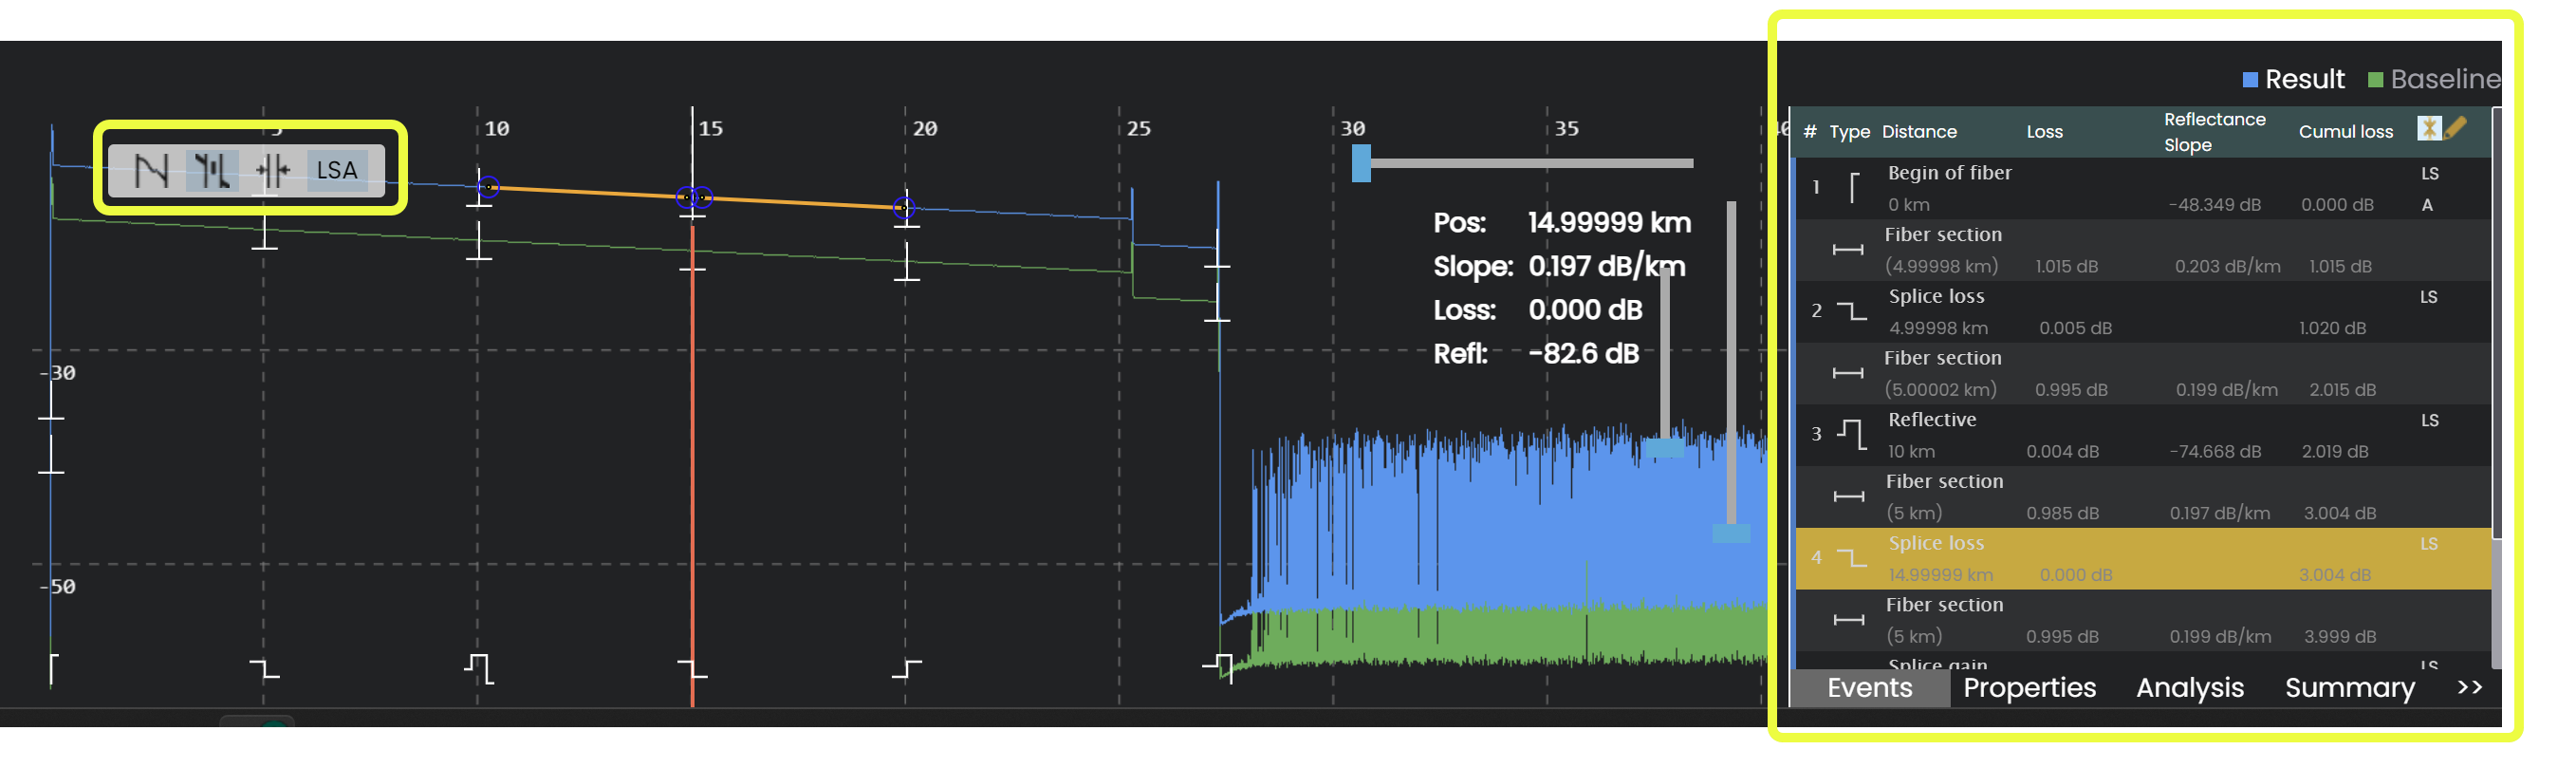
Trace with Parameters shown on the right
Trace Parameters (Events, Properties, Analysis, Summary)
-
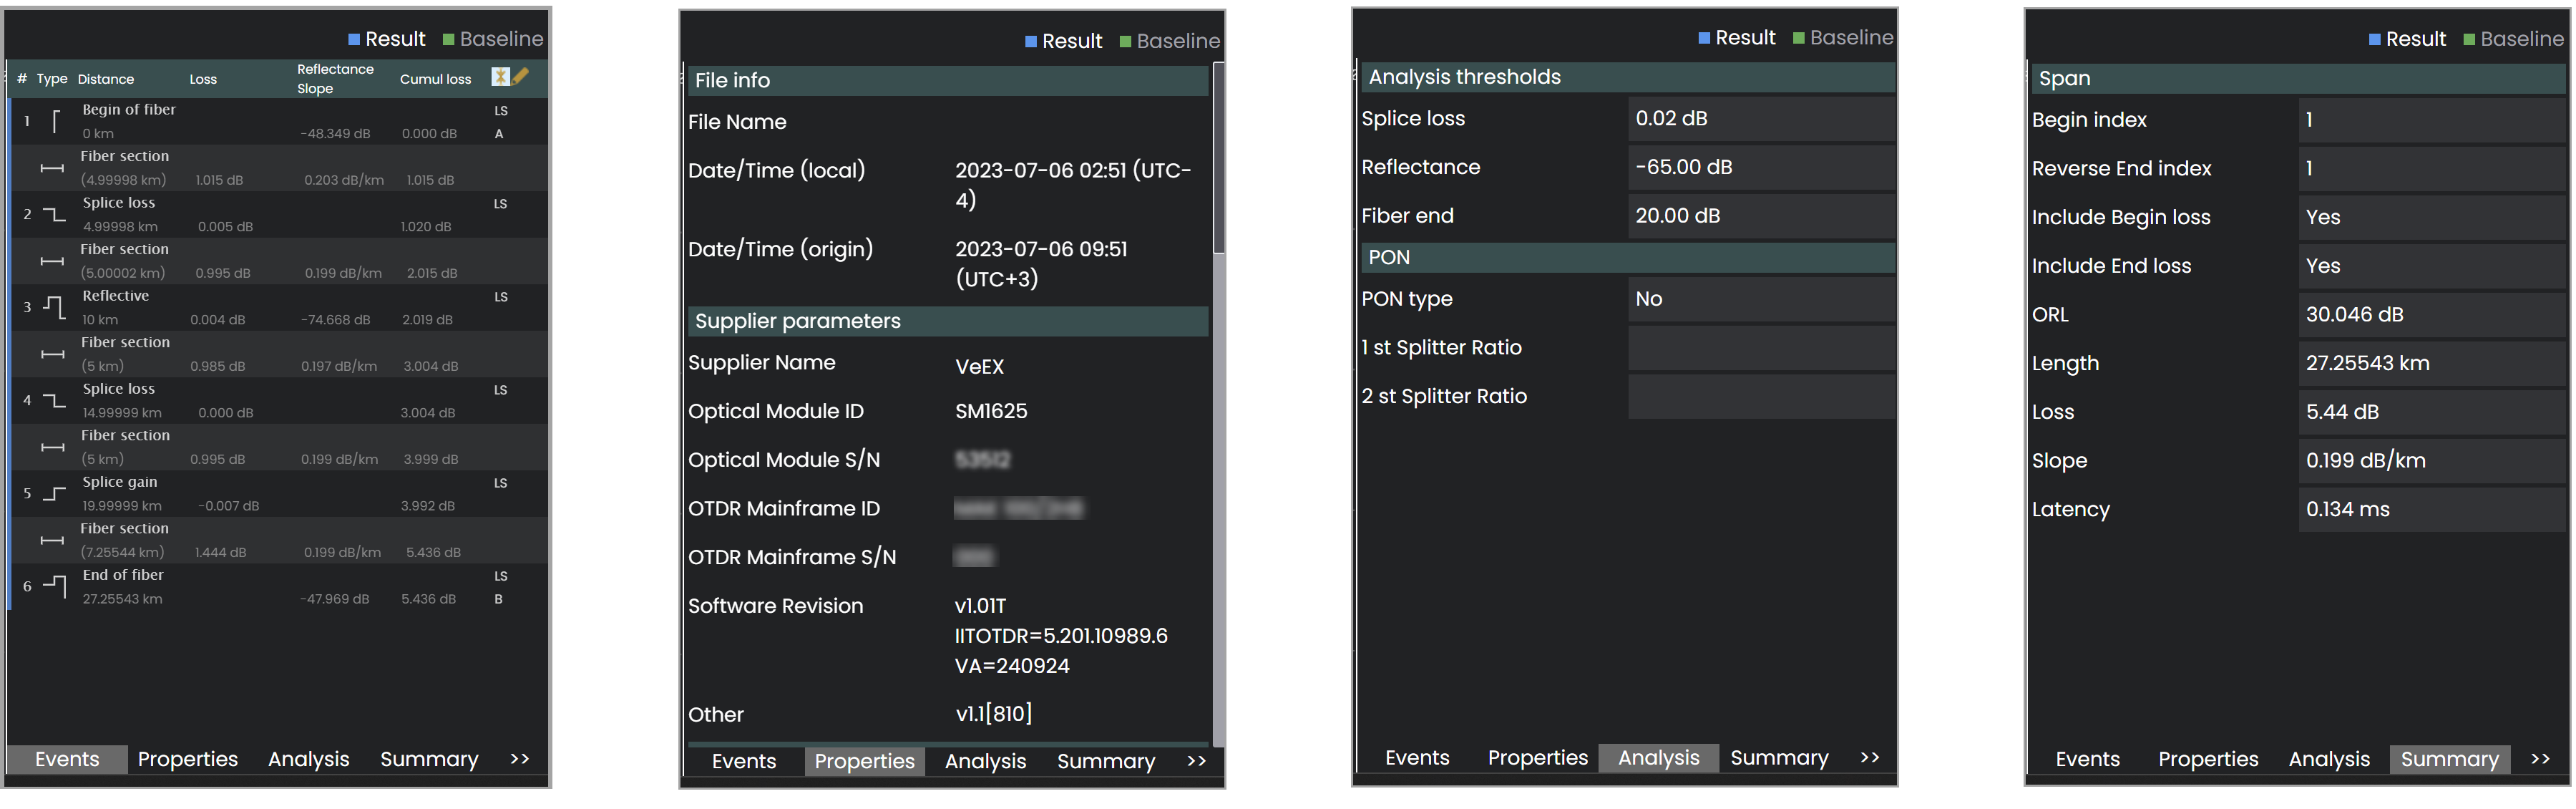
Events: All events associated with the FUT.
-
Properties: SORs file information, OTDR information (serial number, software version, etc.), measurement and optics parameters, and internal temperature.
-
Analysis: Thresholds and PON information (if applicable)
-
Summary: ORL, fiber length, slope, latency, etc.
Trace Analysis and Link map
Refer to Trace Analysis and Link map.
Set New Baseline
Established reference baseline parameters will adjust automatically during monitoring to deliver optimal performance.
Set a new reference base for traces. See Reference Baselines.
Save .SOR File
The baseline and the trace from the last monitoring cycle is saved to the .SOR file.
-
On the Port Dashboard, select Save .SORs
 at the top of the screen.
 -
If needed, change the filename and location, and then click Save.
Provisioning
Provisioning eliminates the trial-and-error phase during a new system turn-up. For each port, the system uses historical data (minimum seven days with no fiber breaks) to recommend thresholds and create a new Alarm Profile. The proposed thresholds can be be reviewed and, if needed, a safety margin set to minimize false alarms.
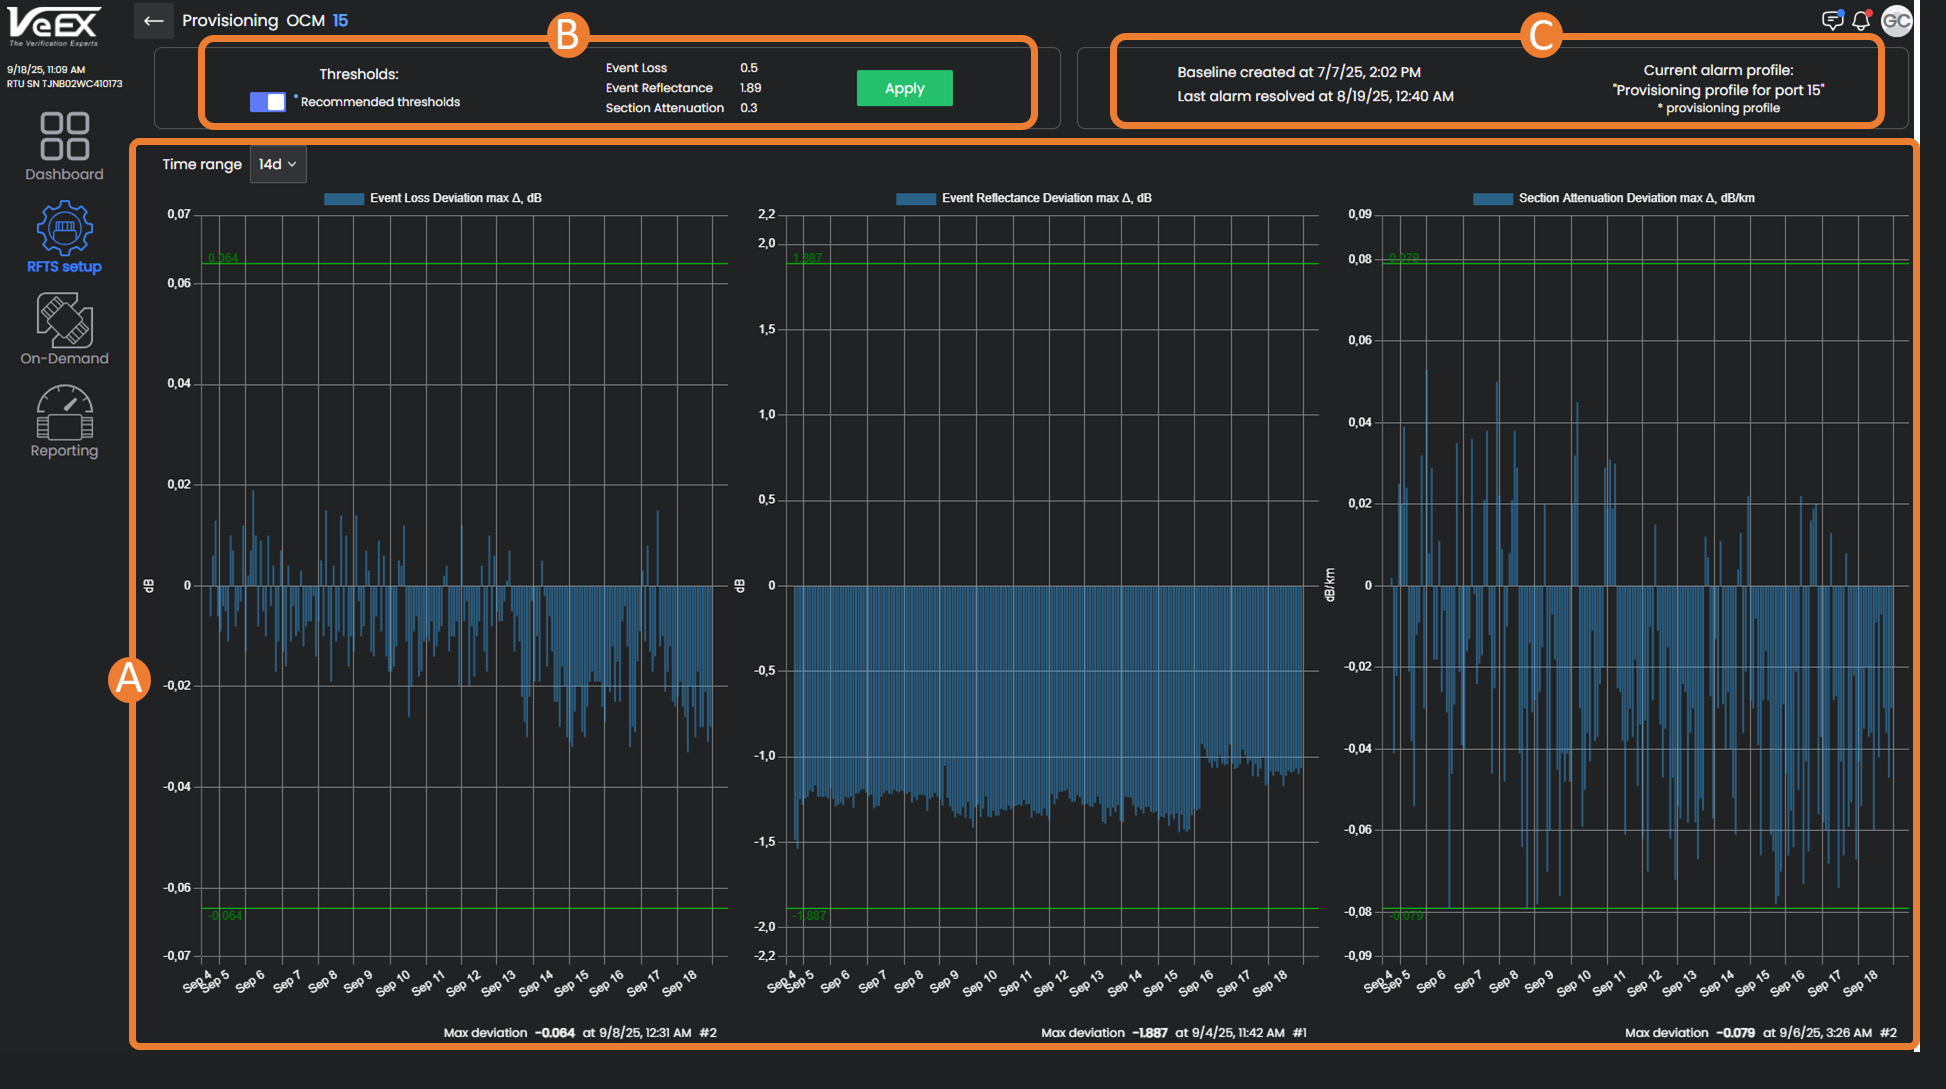
-
Historical data points - Select a time range of data points (7, 14, or 30 days) to see the deviation from max/min thresholds.
-
Recommended Thresholds - Turn ON the Recommended Thresholds switch to use the system recommendations. To make changes, click in the field to enter new values. Click Apply.
-
Port information - Date/time of last baseline, when last alarm was resolved on port, and current alarm profile being used.
Baseline Modeling
Using this tool to accurately reflect the fiber route on Baselines for easier event analysis. See Baseline Modeling.
Maintenance Mode
Place the port in maintenance so that it will be completely excluded from monitoring, but results from the last monitoring cycle will still be visible. For example, for safety when there is a fiber break the port will need to be put in maintenance until the break is repaired to prevent accidental laser incidents. See Optical Connectors.
Upon selecting the Maintenance option ![]() , the icon turns orange
, the icon turns orange ![]() and the Port status switches to Maintenance. Select the option again to take the port out of maintenance.
and the Port status switches to Maintenance. Select the option again to take the port out of maintenance.
Monitoring
Select the Monitoring icon ![]() to turn on/off monitoring.
to turn on/off monitoring.
When actively monitoring, the Monitoring icon turns green ![]() and the Port status switches to "On".
and the Port status switches to "On".
Port Labels and Annotations
Use Port Labels when running On-Demand Tests and performing searches. Label test ports with important inventory, customers, etc. Each port can be tagged with up to 100 labels and reused when needed.