Reporting
The Reporting screen defaults to the Monitoring Alarms Report. There are five pre-defined reports for analysis: Monitoring Alarms, System Events, On-Demand History, Baseline History, Monitoring History. The icons at the top of the page provide the different types of available reports.
Reporting Default View: Monitoring Alarms
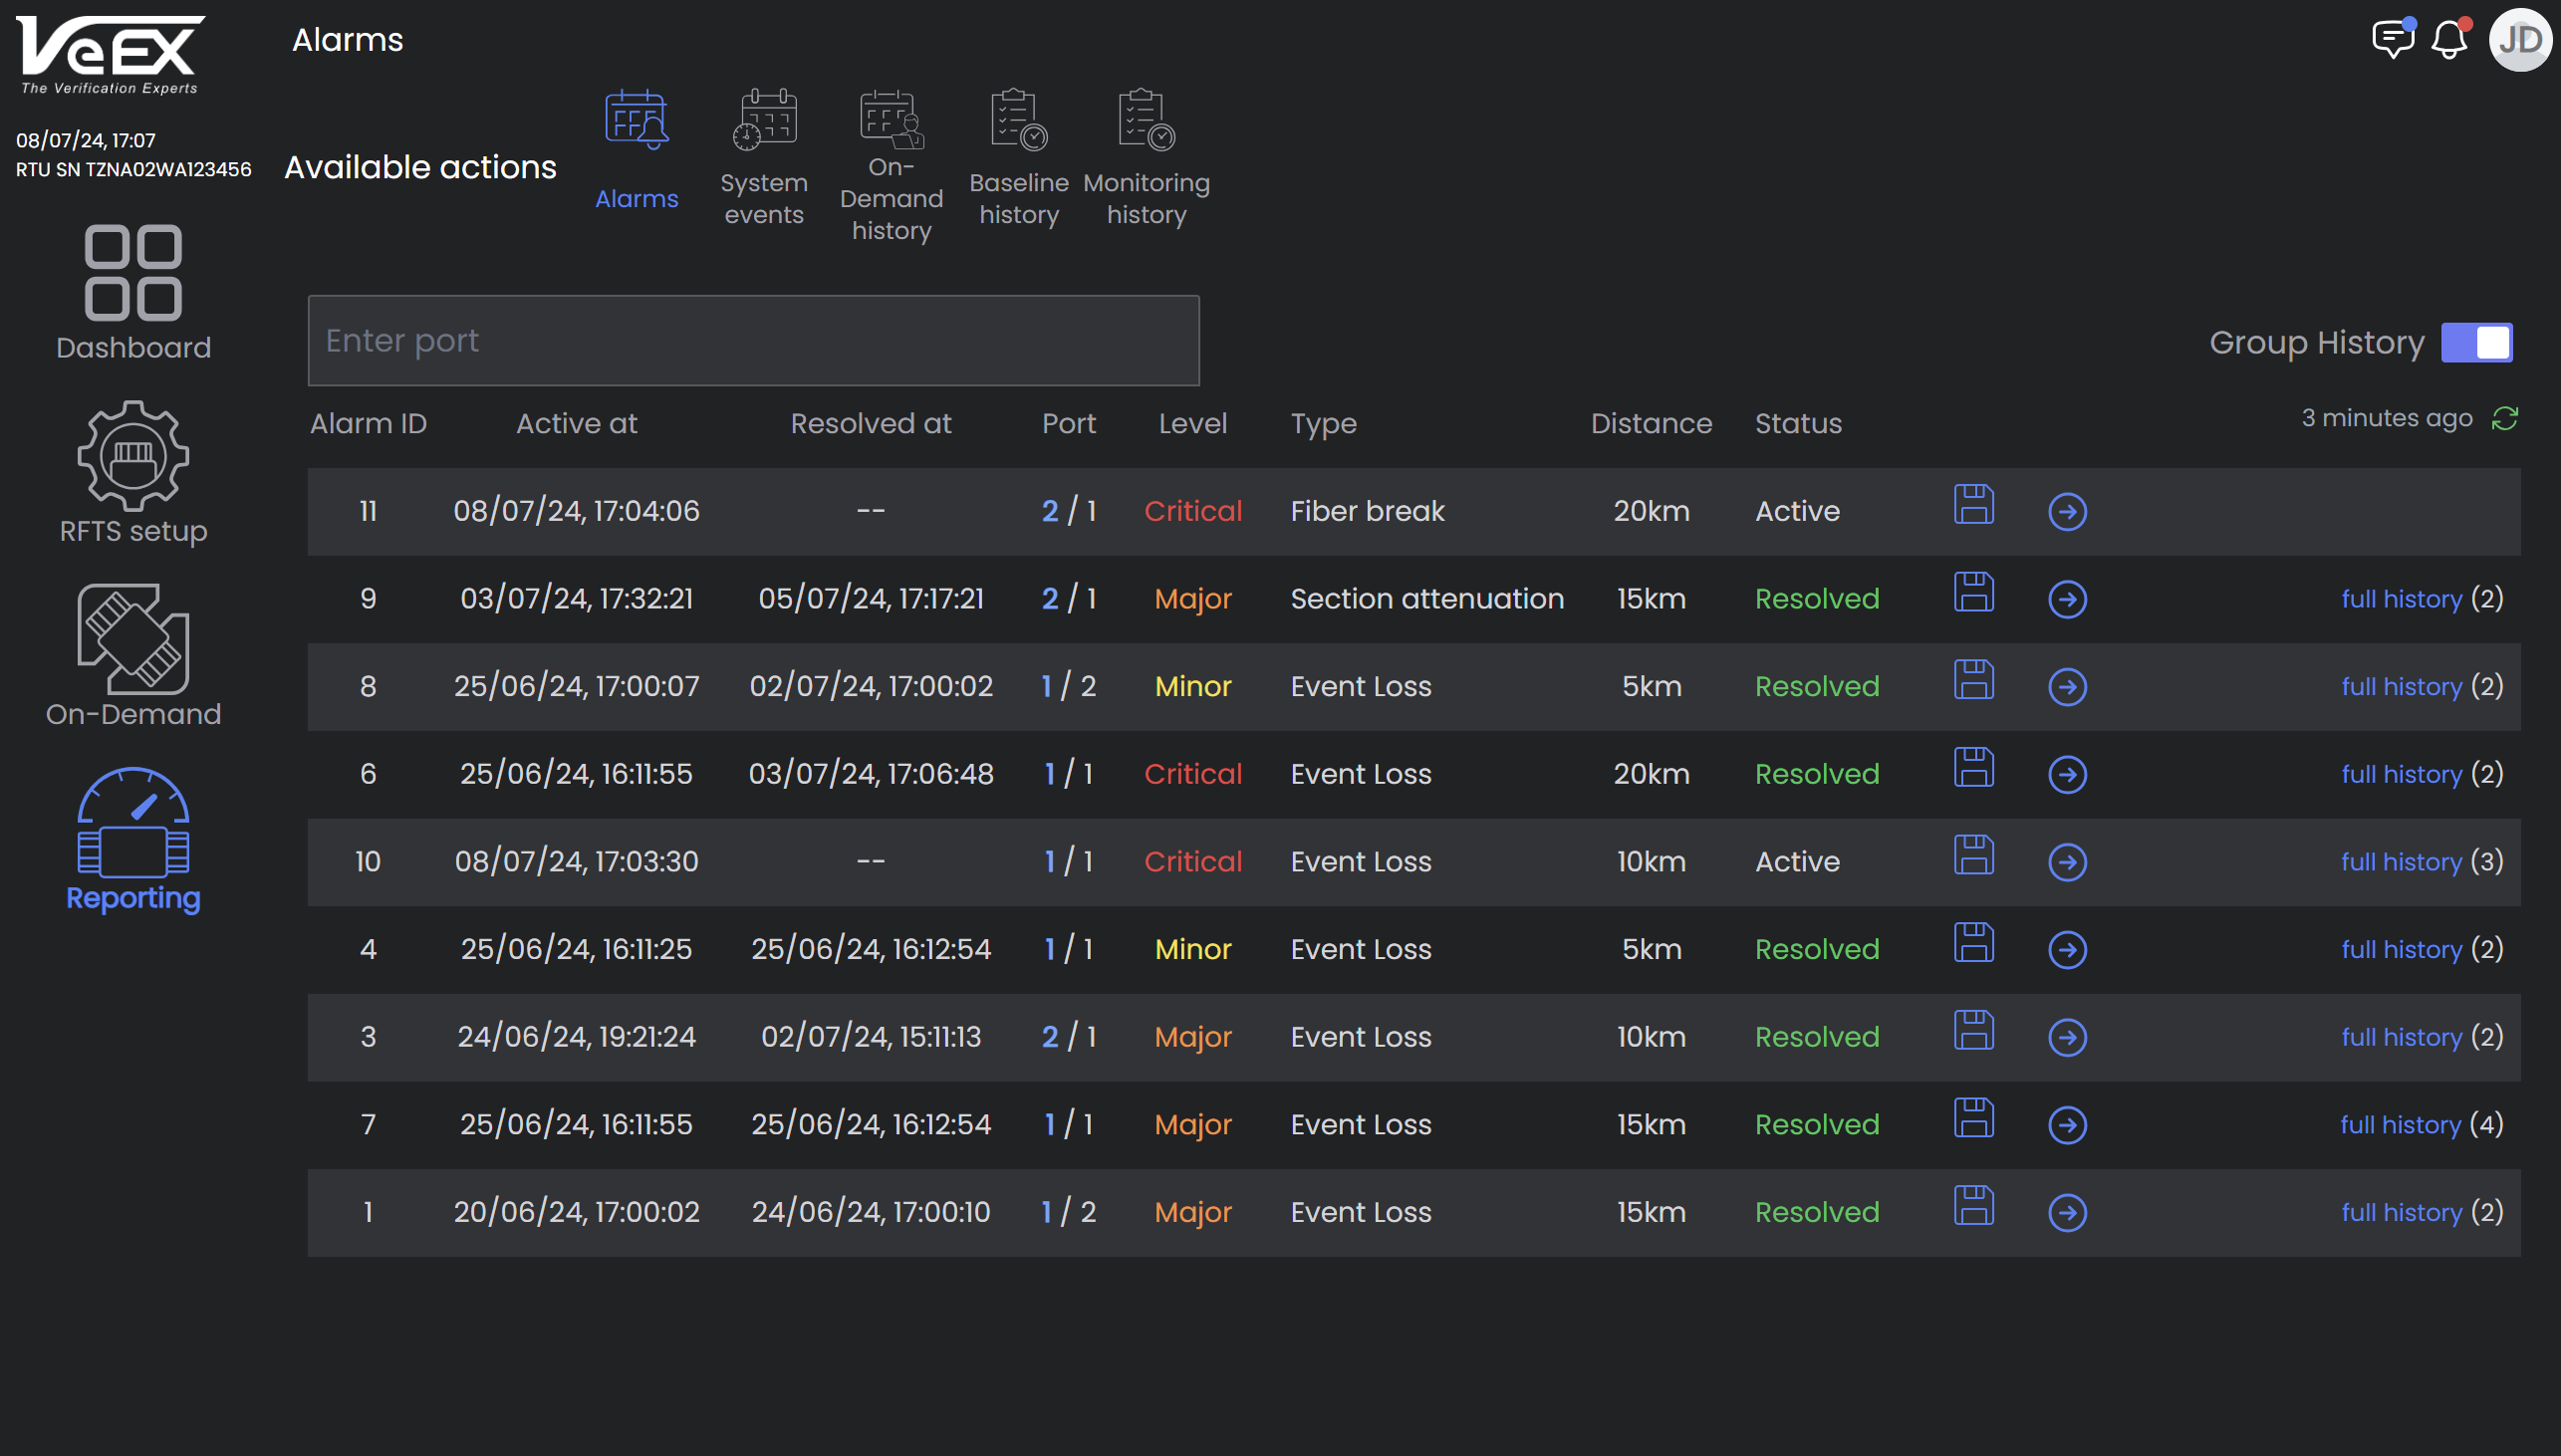
Monitoring Alarms Report
This report shows the full alarms history with the following items:
-
Alarm ID: Number that uniquely identifies the alarm event.
-
Active at/Resolved at: Date/Time the alarm was triggered and resolved. If not yet resolved, no date/time will appear.
-
Port: Switch and port that the alarm occurred on.
-
Level: Level of alarm triggered (minor, major, or critical).
-
Type: Type of alarm triggered (loss, attenuation, reflectance, or fiber break).
-
Distance: Fiber location of event that triggered the alarm.
-
Status: Alarm status (active or resolved).
-
Recipients: Users that were sent notifications of the alarm event.
To filter items to a specific port, select Enter port search bar and choose the switch and port to see events for it only.
The Group History switch, turned on by default, groups events that occur at the same location, as shown below.
Click the Save icon ![]() to save the .SOR file for the alarm. The file will include the baseline trace. Click the arrow link
to save the .SOR file for the alarm. The file will include the baseline trace. Click the arrow link ![]() to view the trace associated with the alarm. See Alarms List.
to view the trace associated with the alarm. See Alarms List.
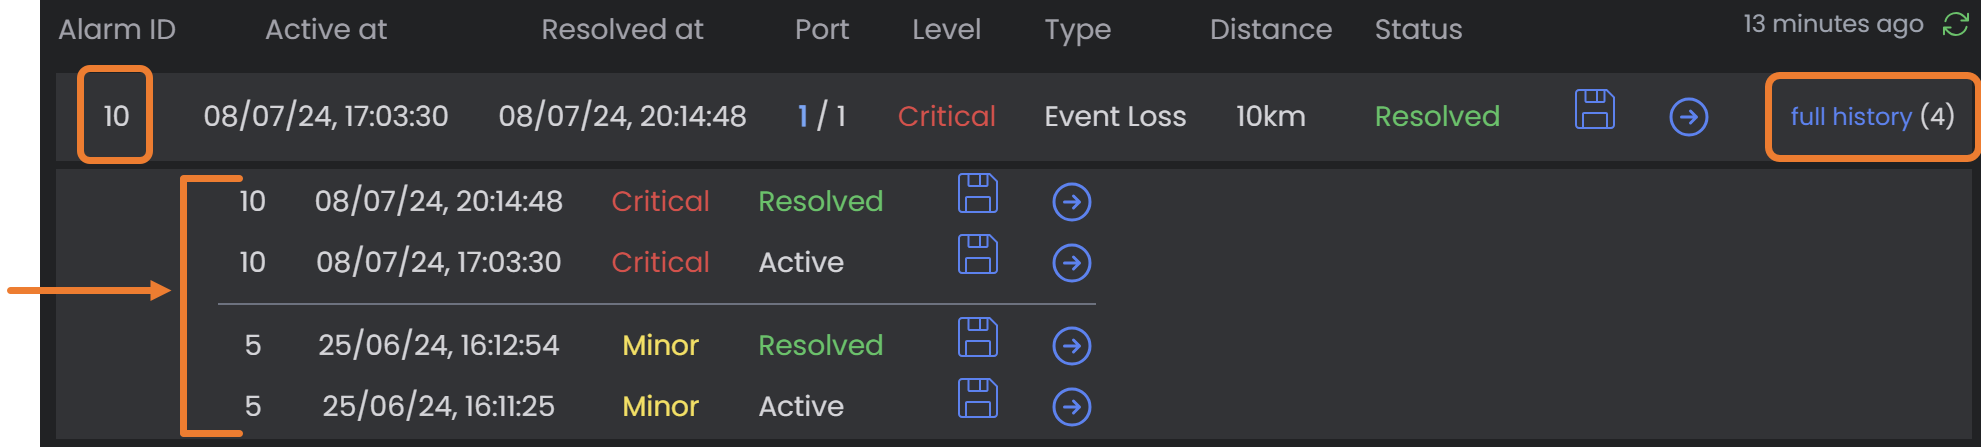
Alarms Report: Full History
System Alarms Report
The System Events Report shows when an OTDR went offline with the following items:
-
Alarm ID: Number that uniquely identifies the system alarm event.
-
Date Time: Date and Time of the alarm event.
-
Alarm: Type of system alarm triggered.
-
Status: Alarm status (active or resolved).
-
Recipients: Users that were sent notifications of the system alarm event.
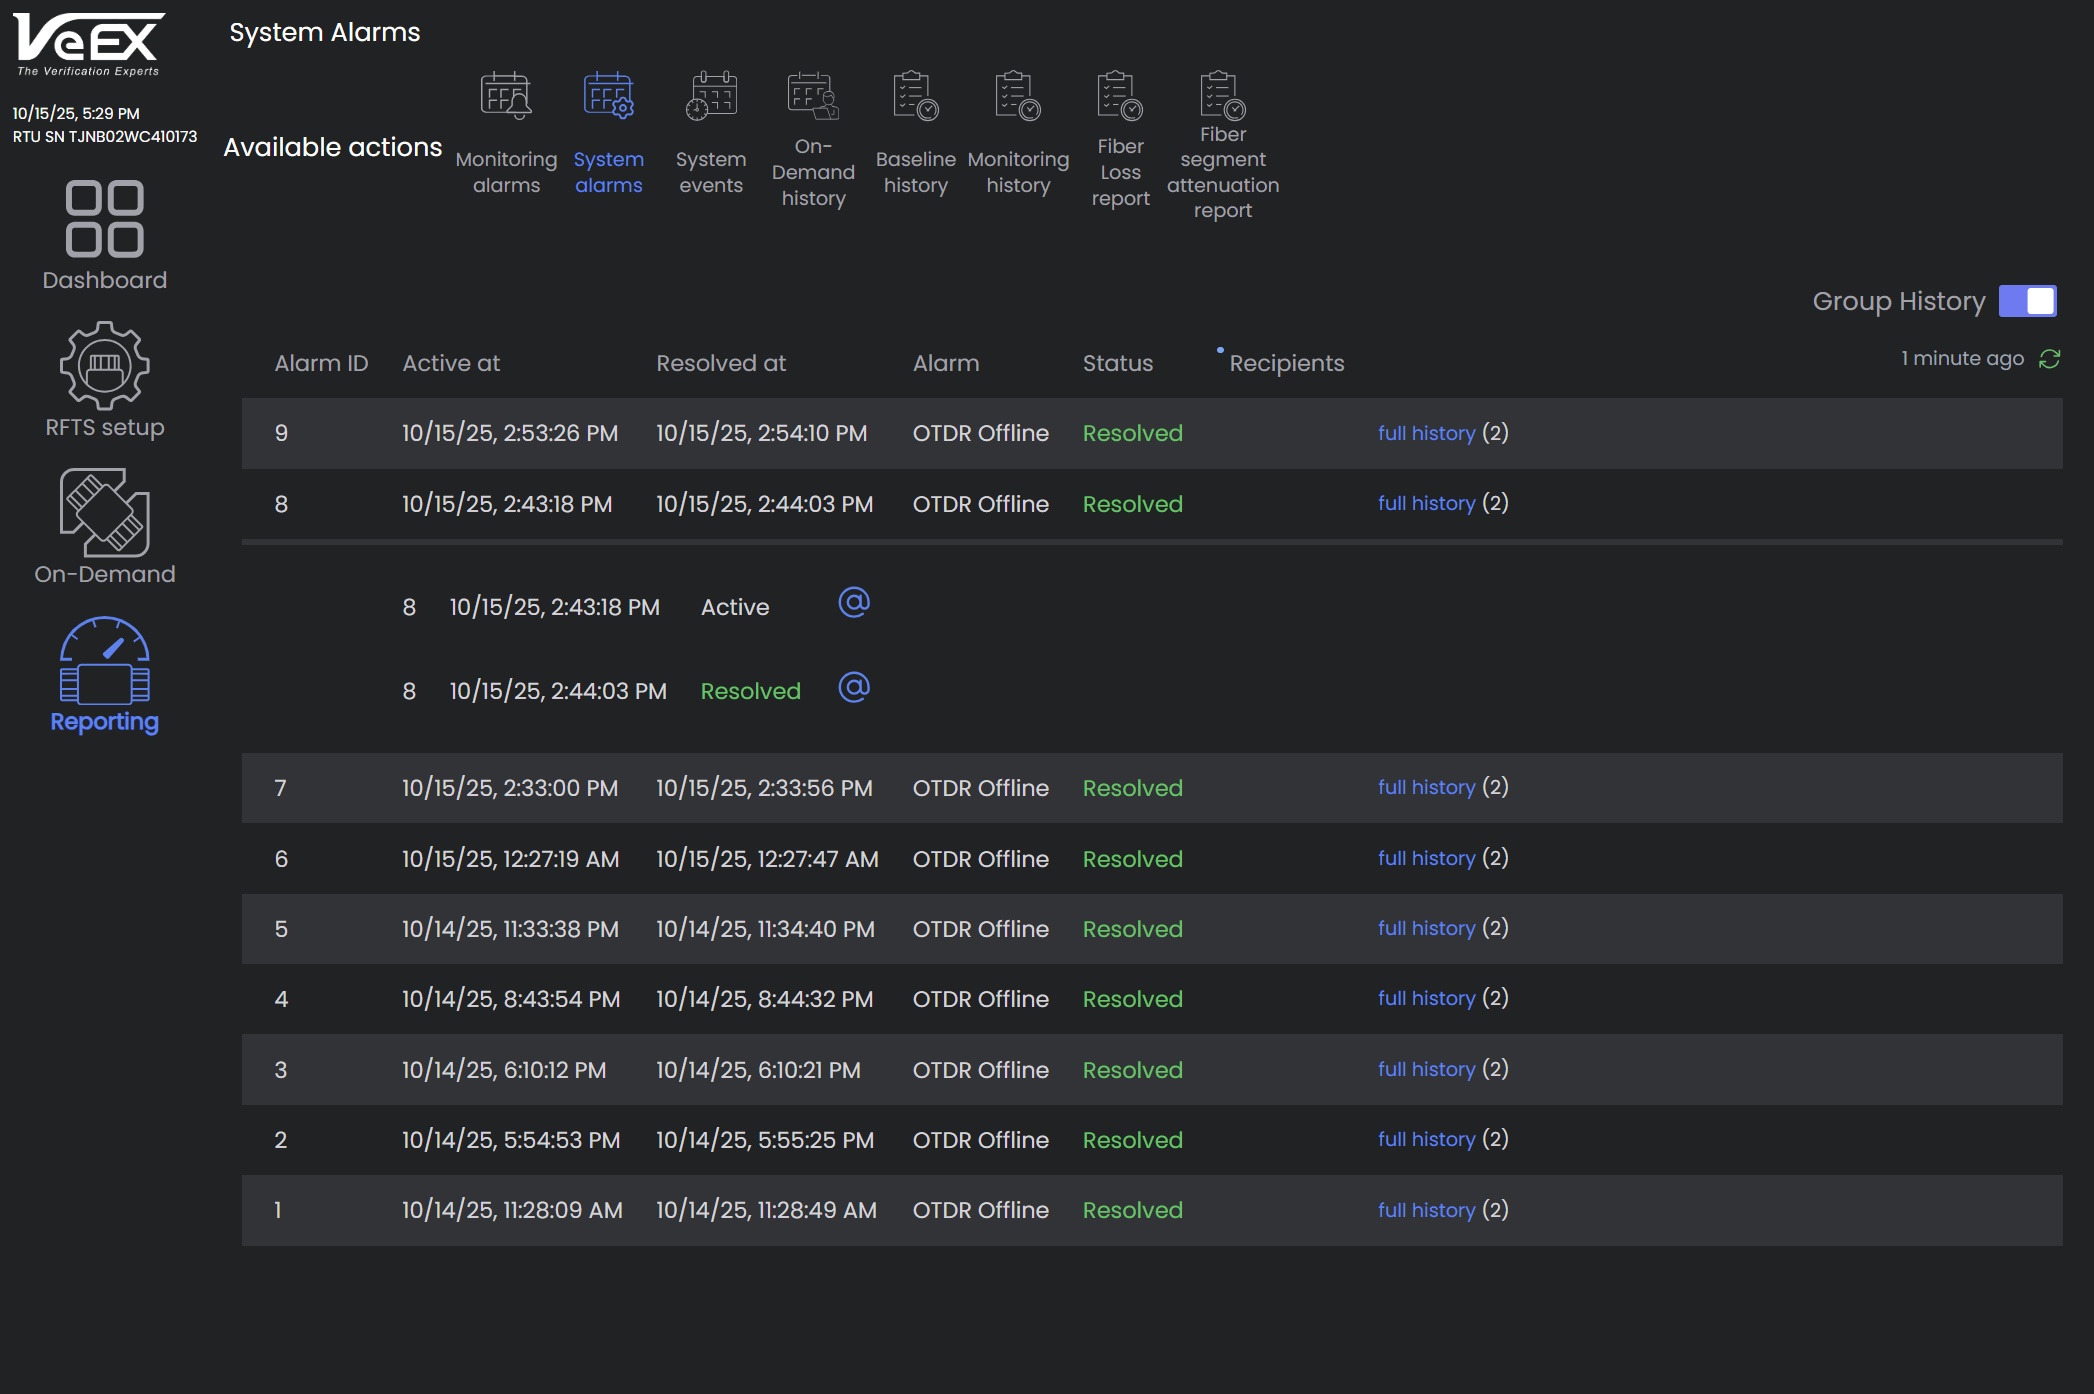
System Alarms Report
System Events Report
The System Events Report shows all system-wide changes and the users who performed the changes, as well as who the changes affected.
This report shows the full alarms history with the following items:
-
At: Date/Time of the event.
-
Level: Type of action (Info, Critical, Major, Minor)
-
Source: User who performed the action.
-
Event: Action taken place. If applicable, the switch and port that is associated with the action is listed and the monitoring schedule assigned.
For on-demand tests, click the arrow link ![]() to view the trace associated with the on-demand test.
to view the trace associated with the on-demand test.
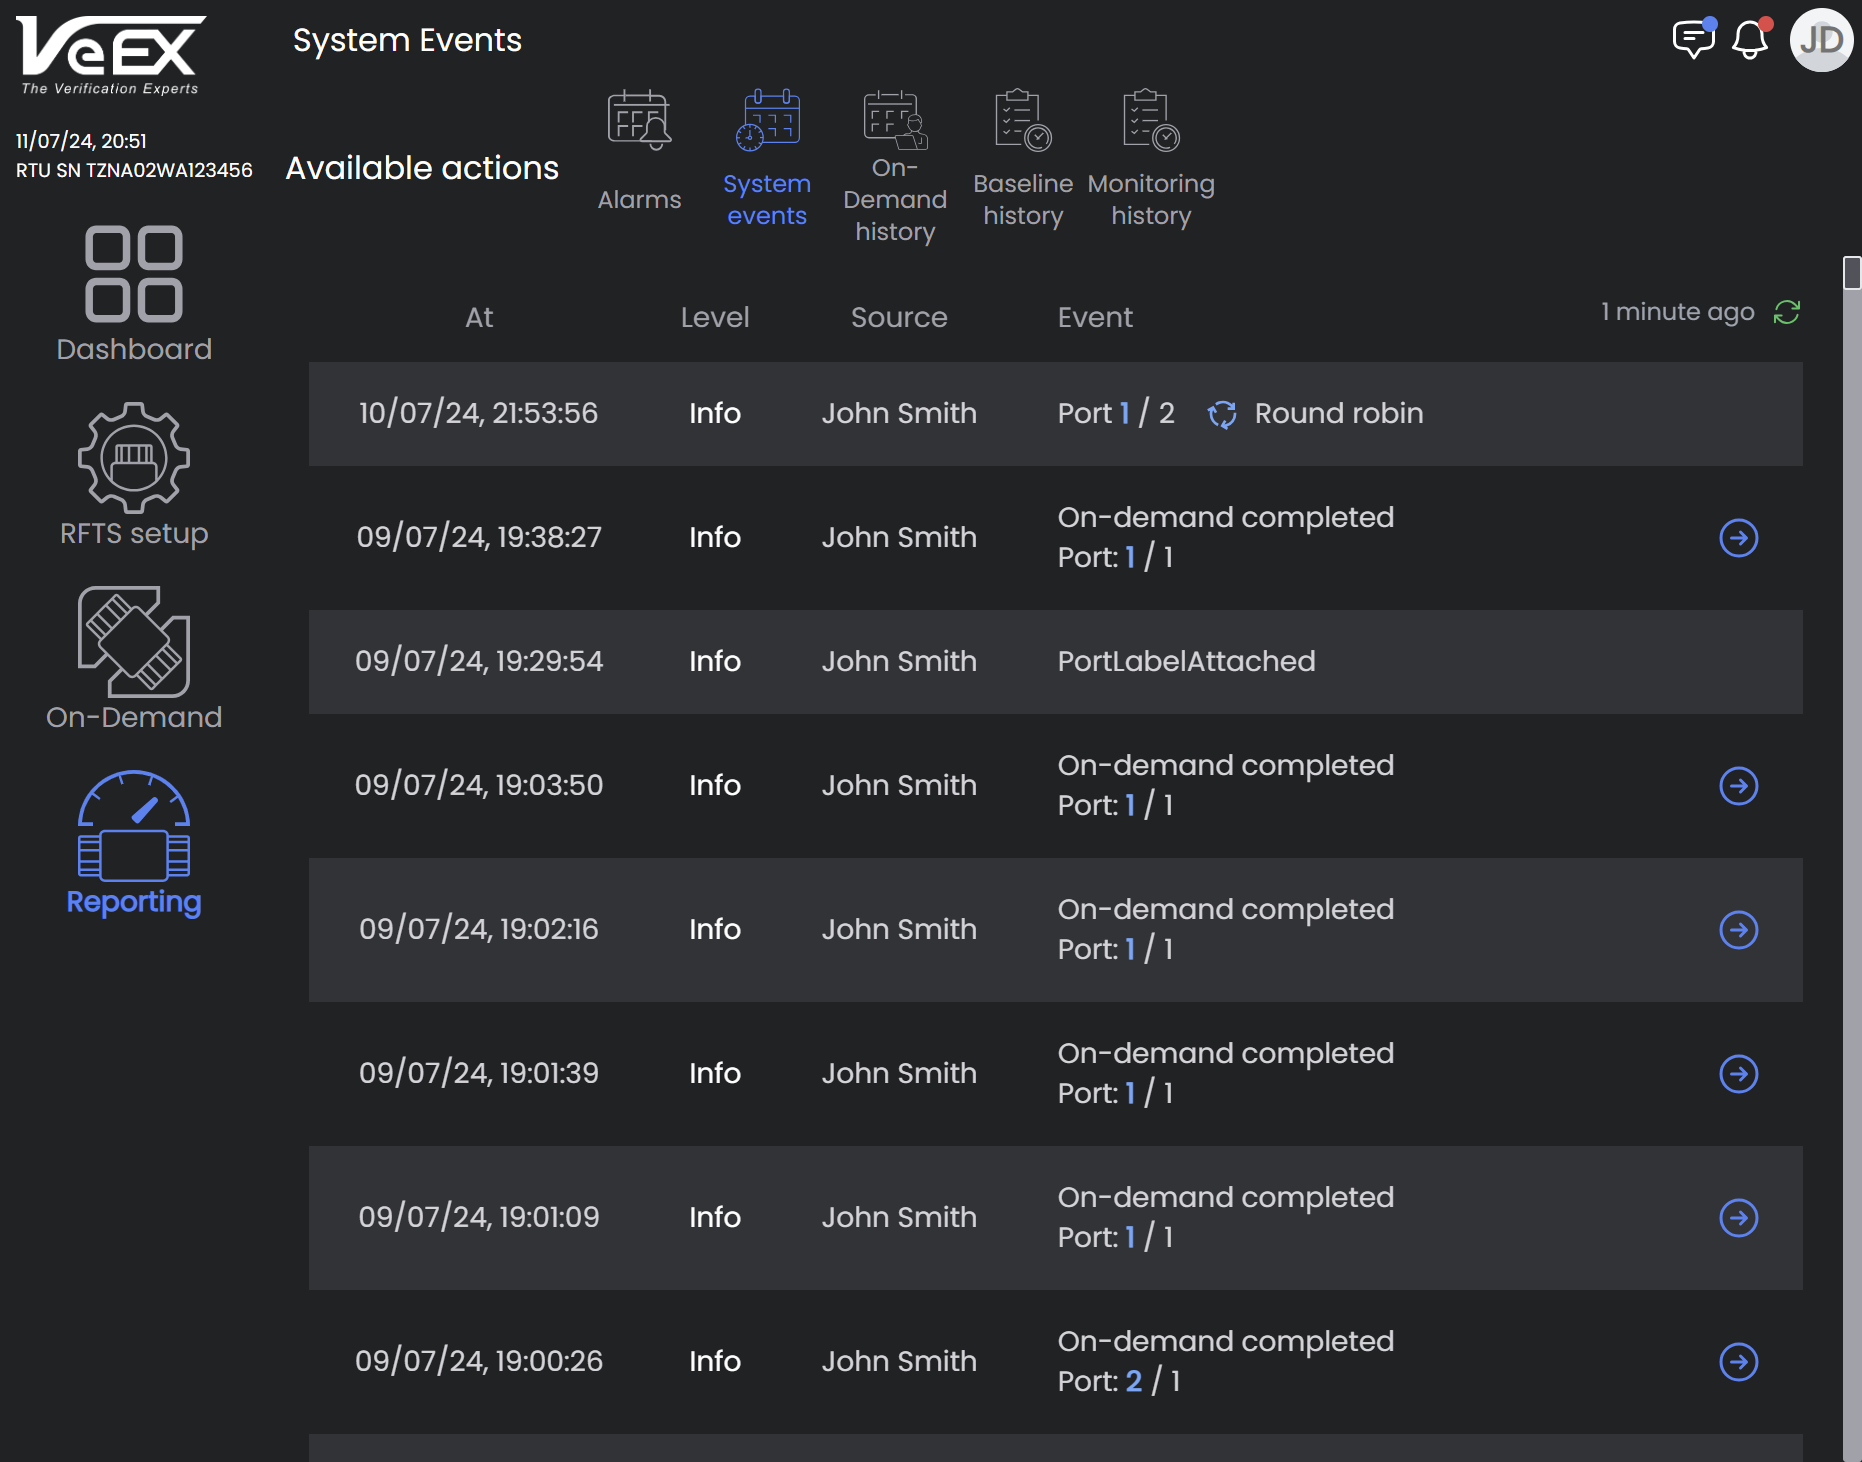
Event Log Report
On-Demand History Report
This report tracks who performed an On-Demand Test, since no monitoring occurs while an On-Demand Test is running.
To filter items to a specific port, select Enter port search bar and choose the switch and port to see events for it only.
Click the arrow link ![]() to view the trace associated with the alarm.
to view the trace associated with the alarm.
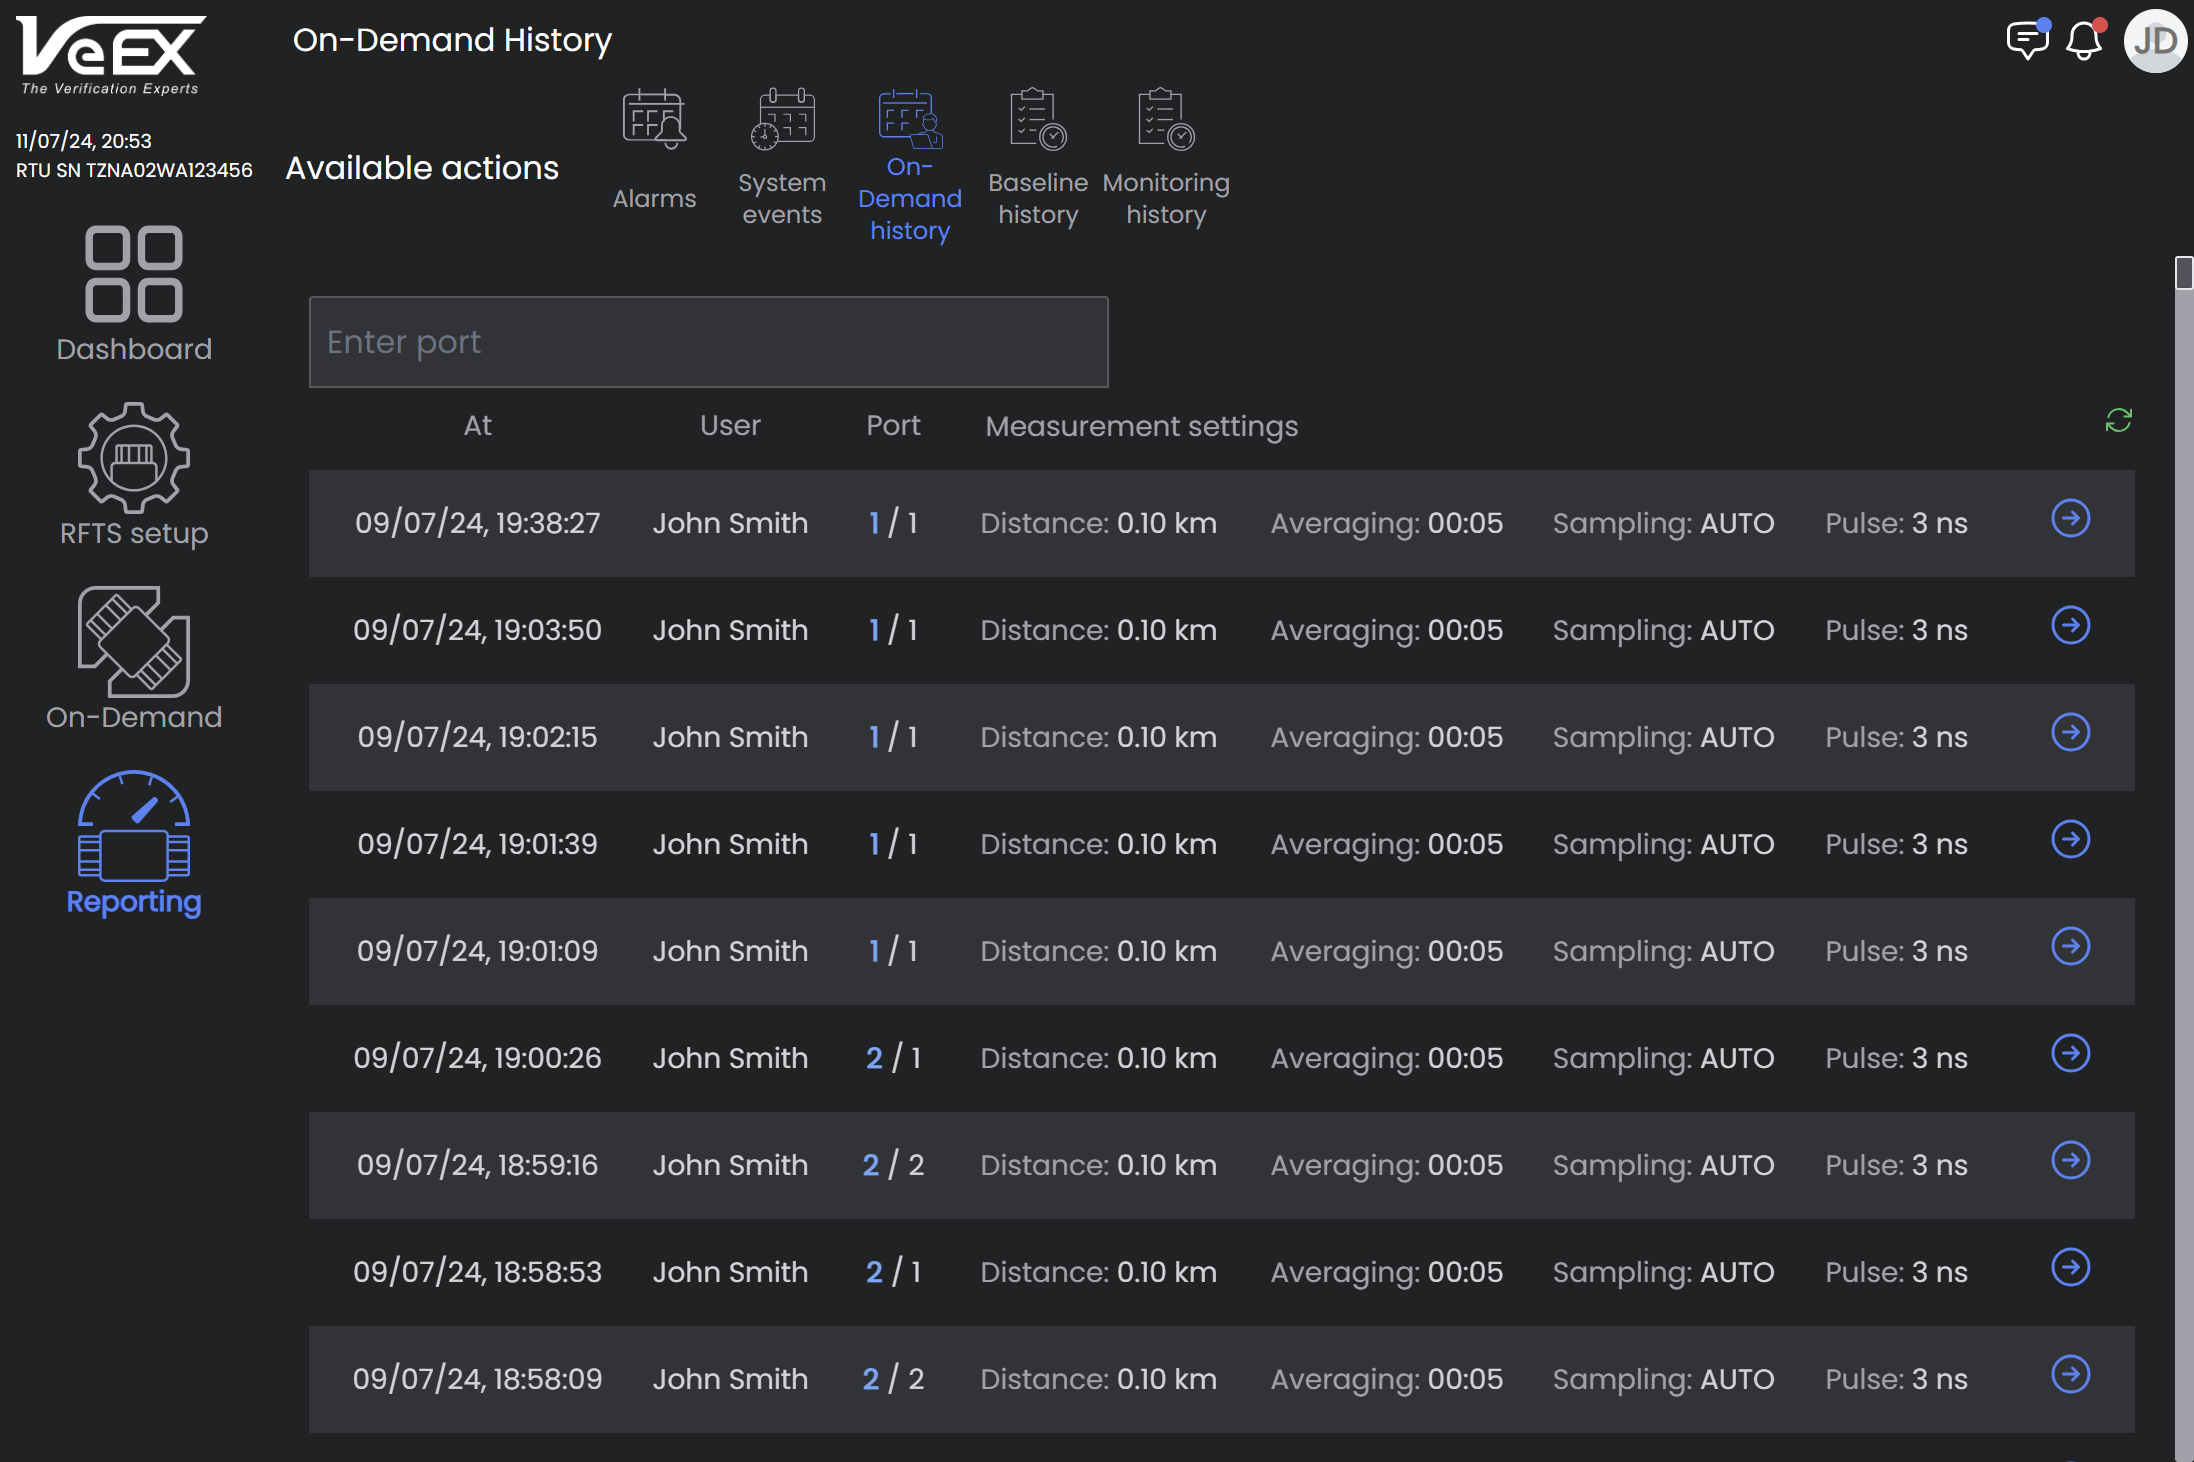
On-Demand History Report
Baseline History Report
The Baseline History Report shows all reference baselines performed on ports and the users who ran the baselines.
To filter items to a specific port, select Enter port search bar and choose the switch and port to see events for it only.
Click the Save icon ![]() to save the .SOR file for the alarm. The file will include the baseline trace. Click the arrow link
to save the .SOR file for the alarm. The file will include the baseline trace. Click the arrow link ![]() to view the trace associated with the alarm. For more information on viewing baselines, see Reference Baselines.
to view the trace associated with the alarm. For more information on viewing baselines, see Reference Baselines.
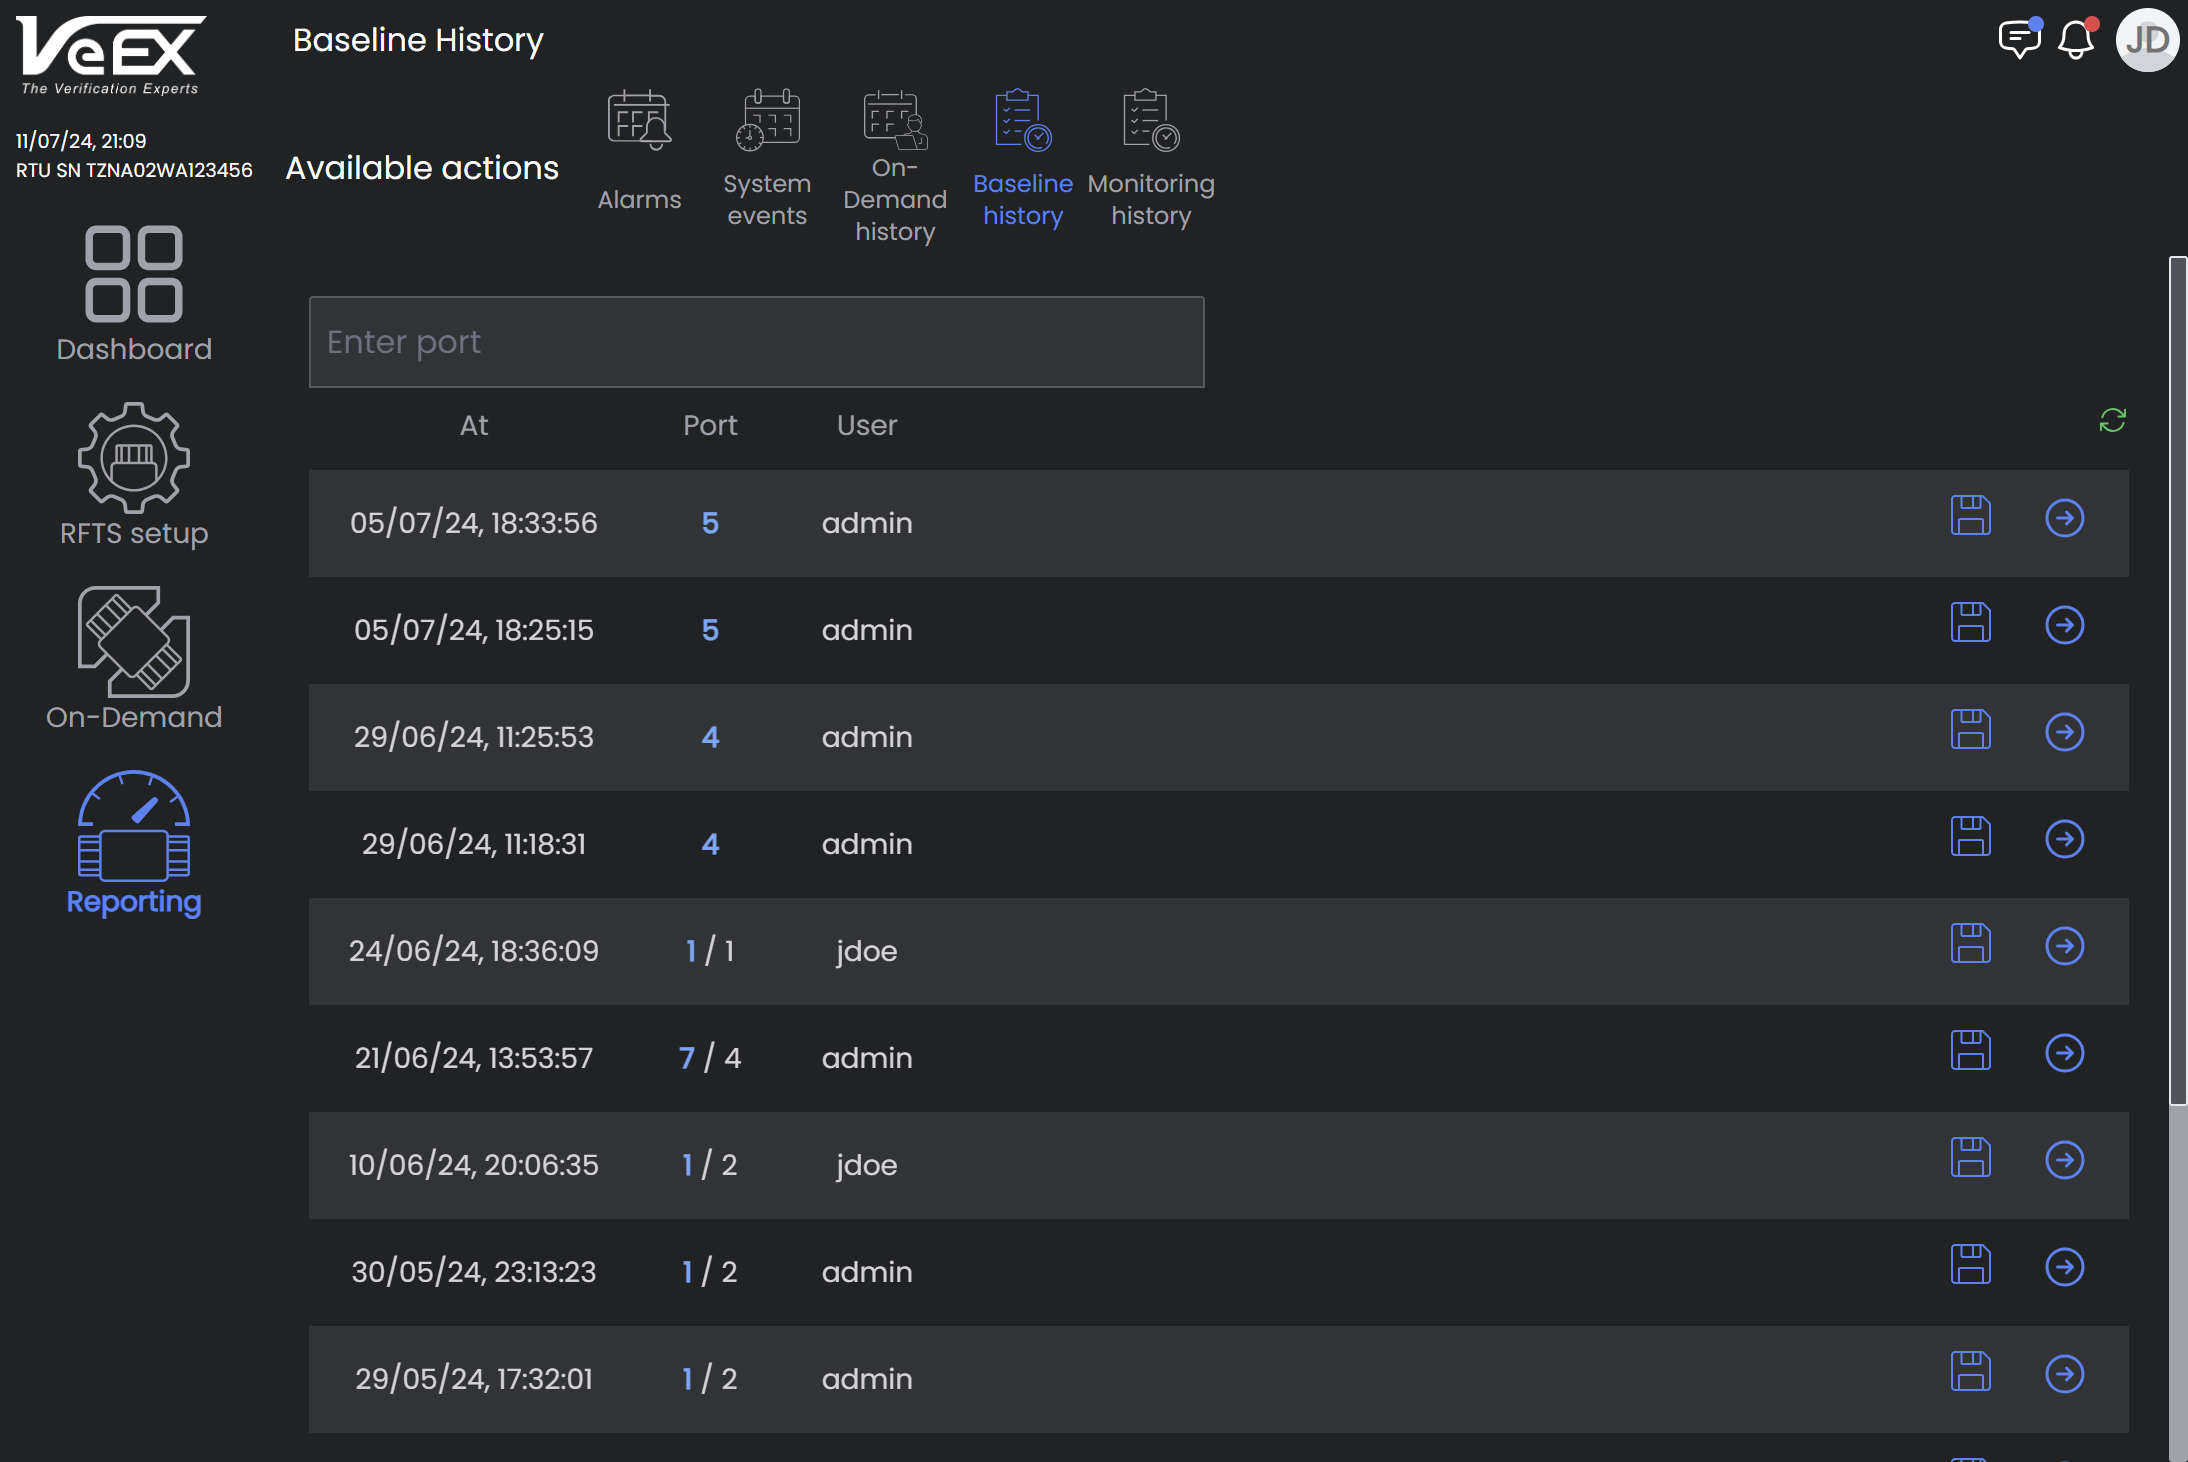
Reference Baseline Report
Monitoring History
This report checks the data log to view past events on a given switch and port and determine it's health.
Select the At arrow to sort the log entries in ascending or descending order by date/time. To filter items to a specific port, select Enter port search bar and choose the switch and port to see events for it only.
Select the Download .SORs icon ![]() to download both the baseline and the trace that generated or resolved the alarms .
to download both the baseline and the trace that generated or resolved the alarms .
Select the arrow icon ![]() to check alarm details and view the history for comparison. For more information on viewing traces, see Trace Analysis.
to check alarm details and view the history for comparison. For more information on viewing traces, see Trace Analysis.
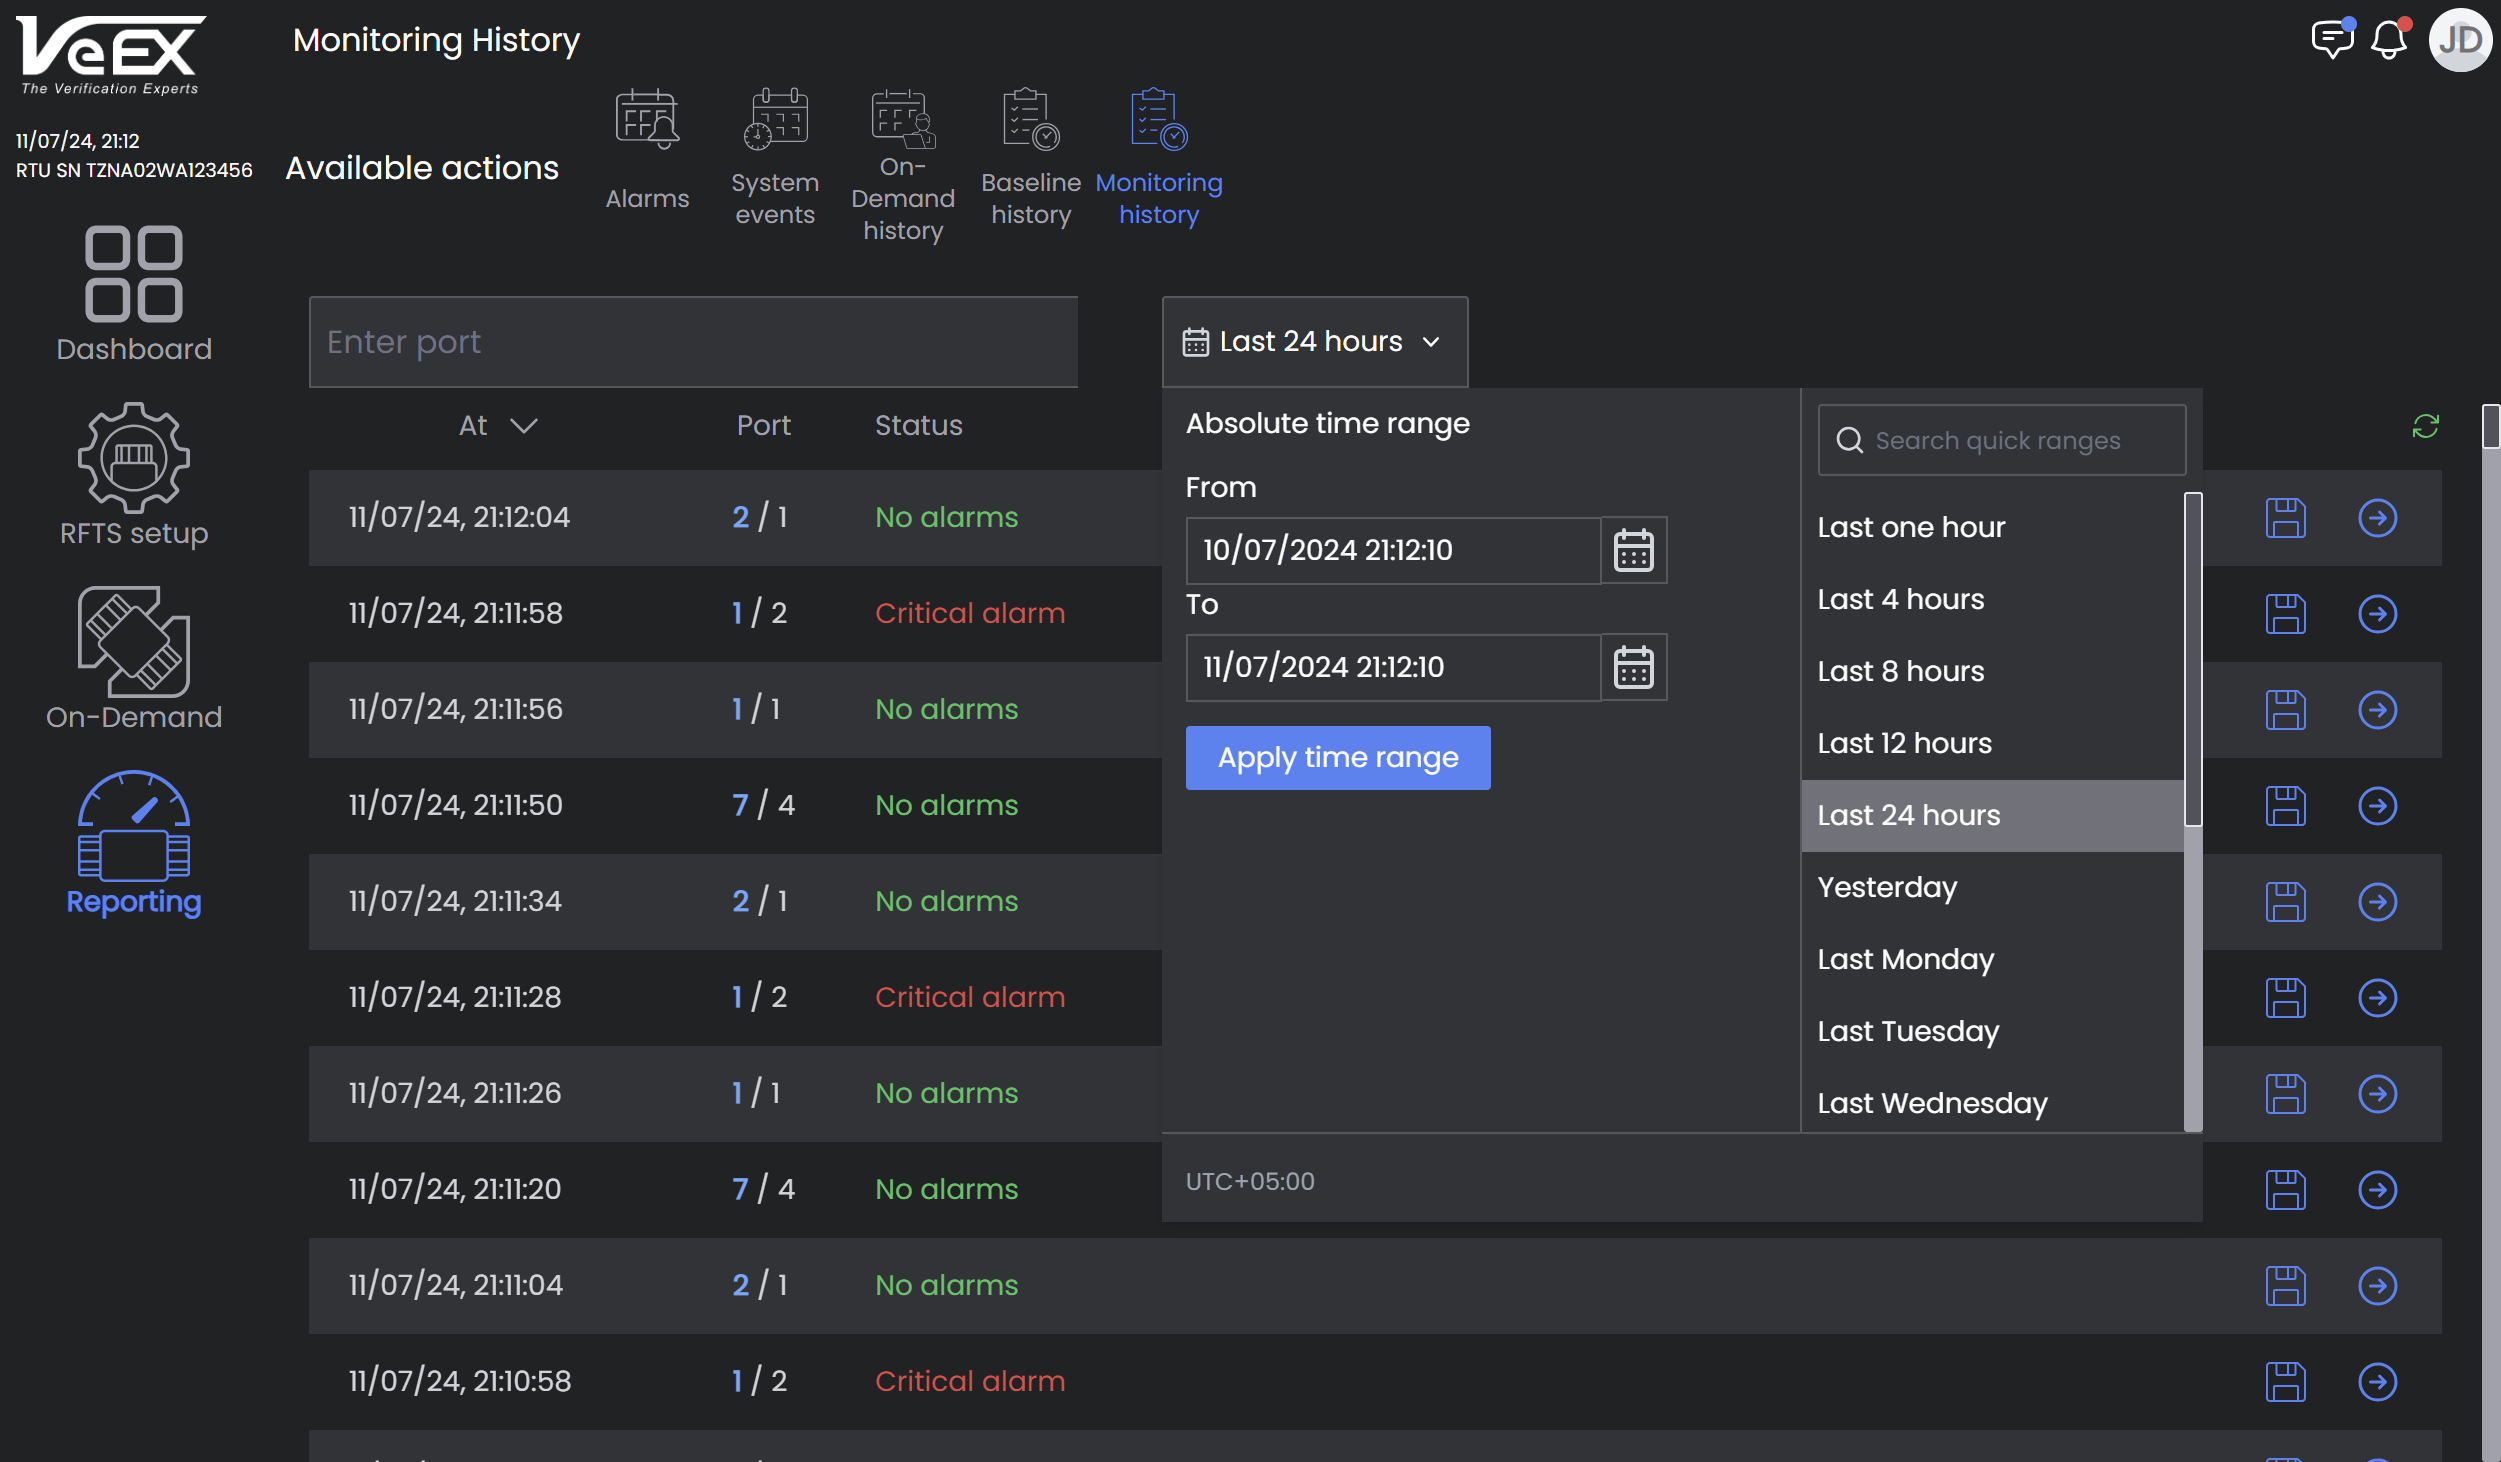
Monitoring History Report
Fiber Loss Report
This report summarizes loss for selected ports over a specified time period. To filter items to a specific port or label, select the Enter port or Enter label search bar and choose the switch and port to see loss metrics for it only. When multiple ports and/or labels are selected, graphs for each selected port/label will appear unless the Overlay mode is turned on so all metrics appear on a single graph.
-
Overlay mode: All selected ports are plotted on single graph for comparison. Compare up to 500 fibers in overlay mode.
-
Advanced control: Select metrics to display on graph.
-
Show Min.loss: Measurements that exceed outside minimum threshold settings.
-
Show Max.loss: Measurements that exceed outside maximum threshold settings.
-
Show P/V difference: Difference between minimum loss and maximum loss.
-
Show percentile: Percentage of time used for performance indicators (Min.loss, Max.loss, P/V difference), e.g. Maximum loss over 80% of time.
-
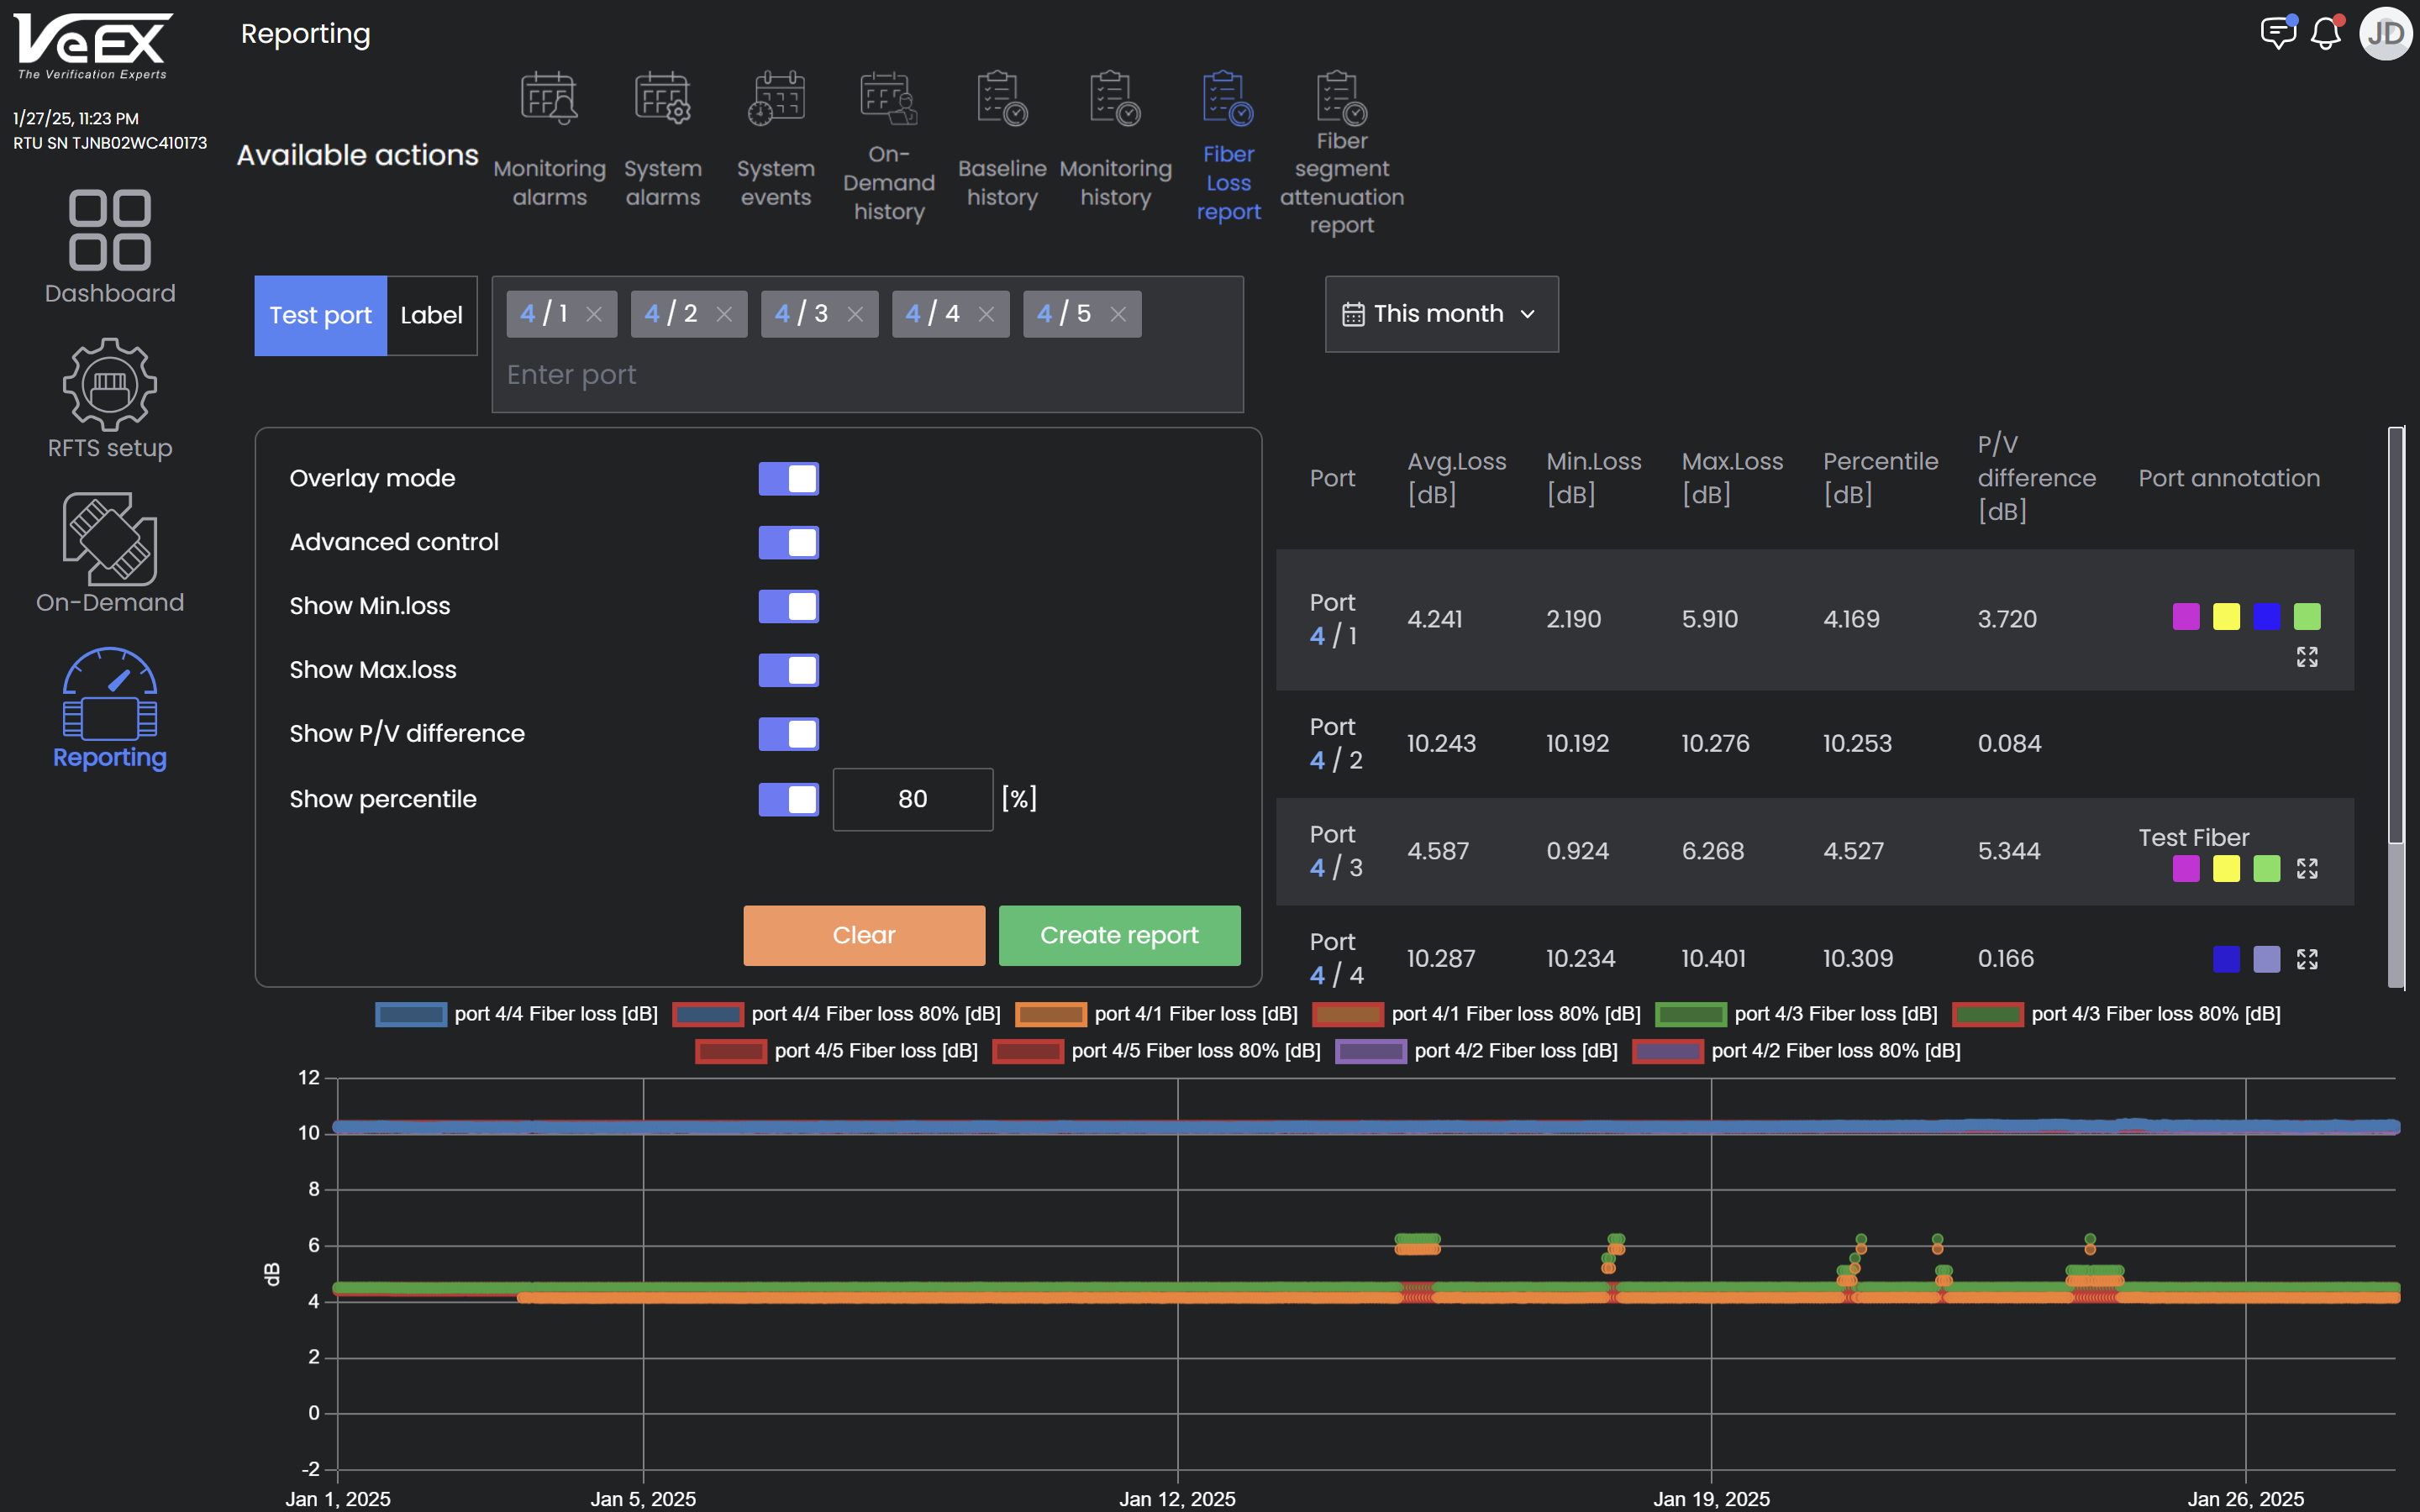
Fiber Loss Report for multiple ports overlayed and plotted on single graph
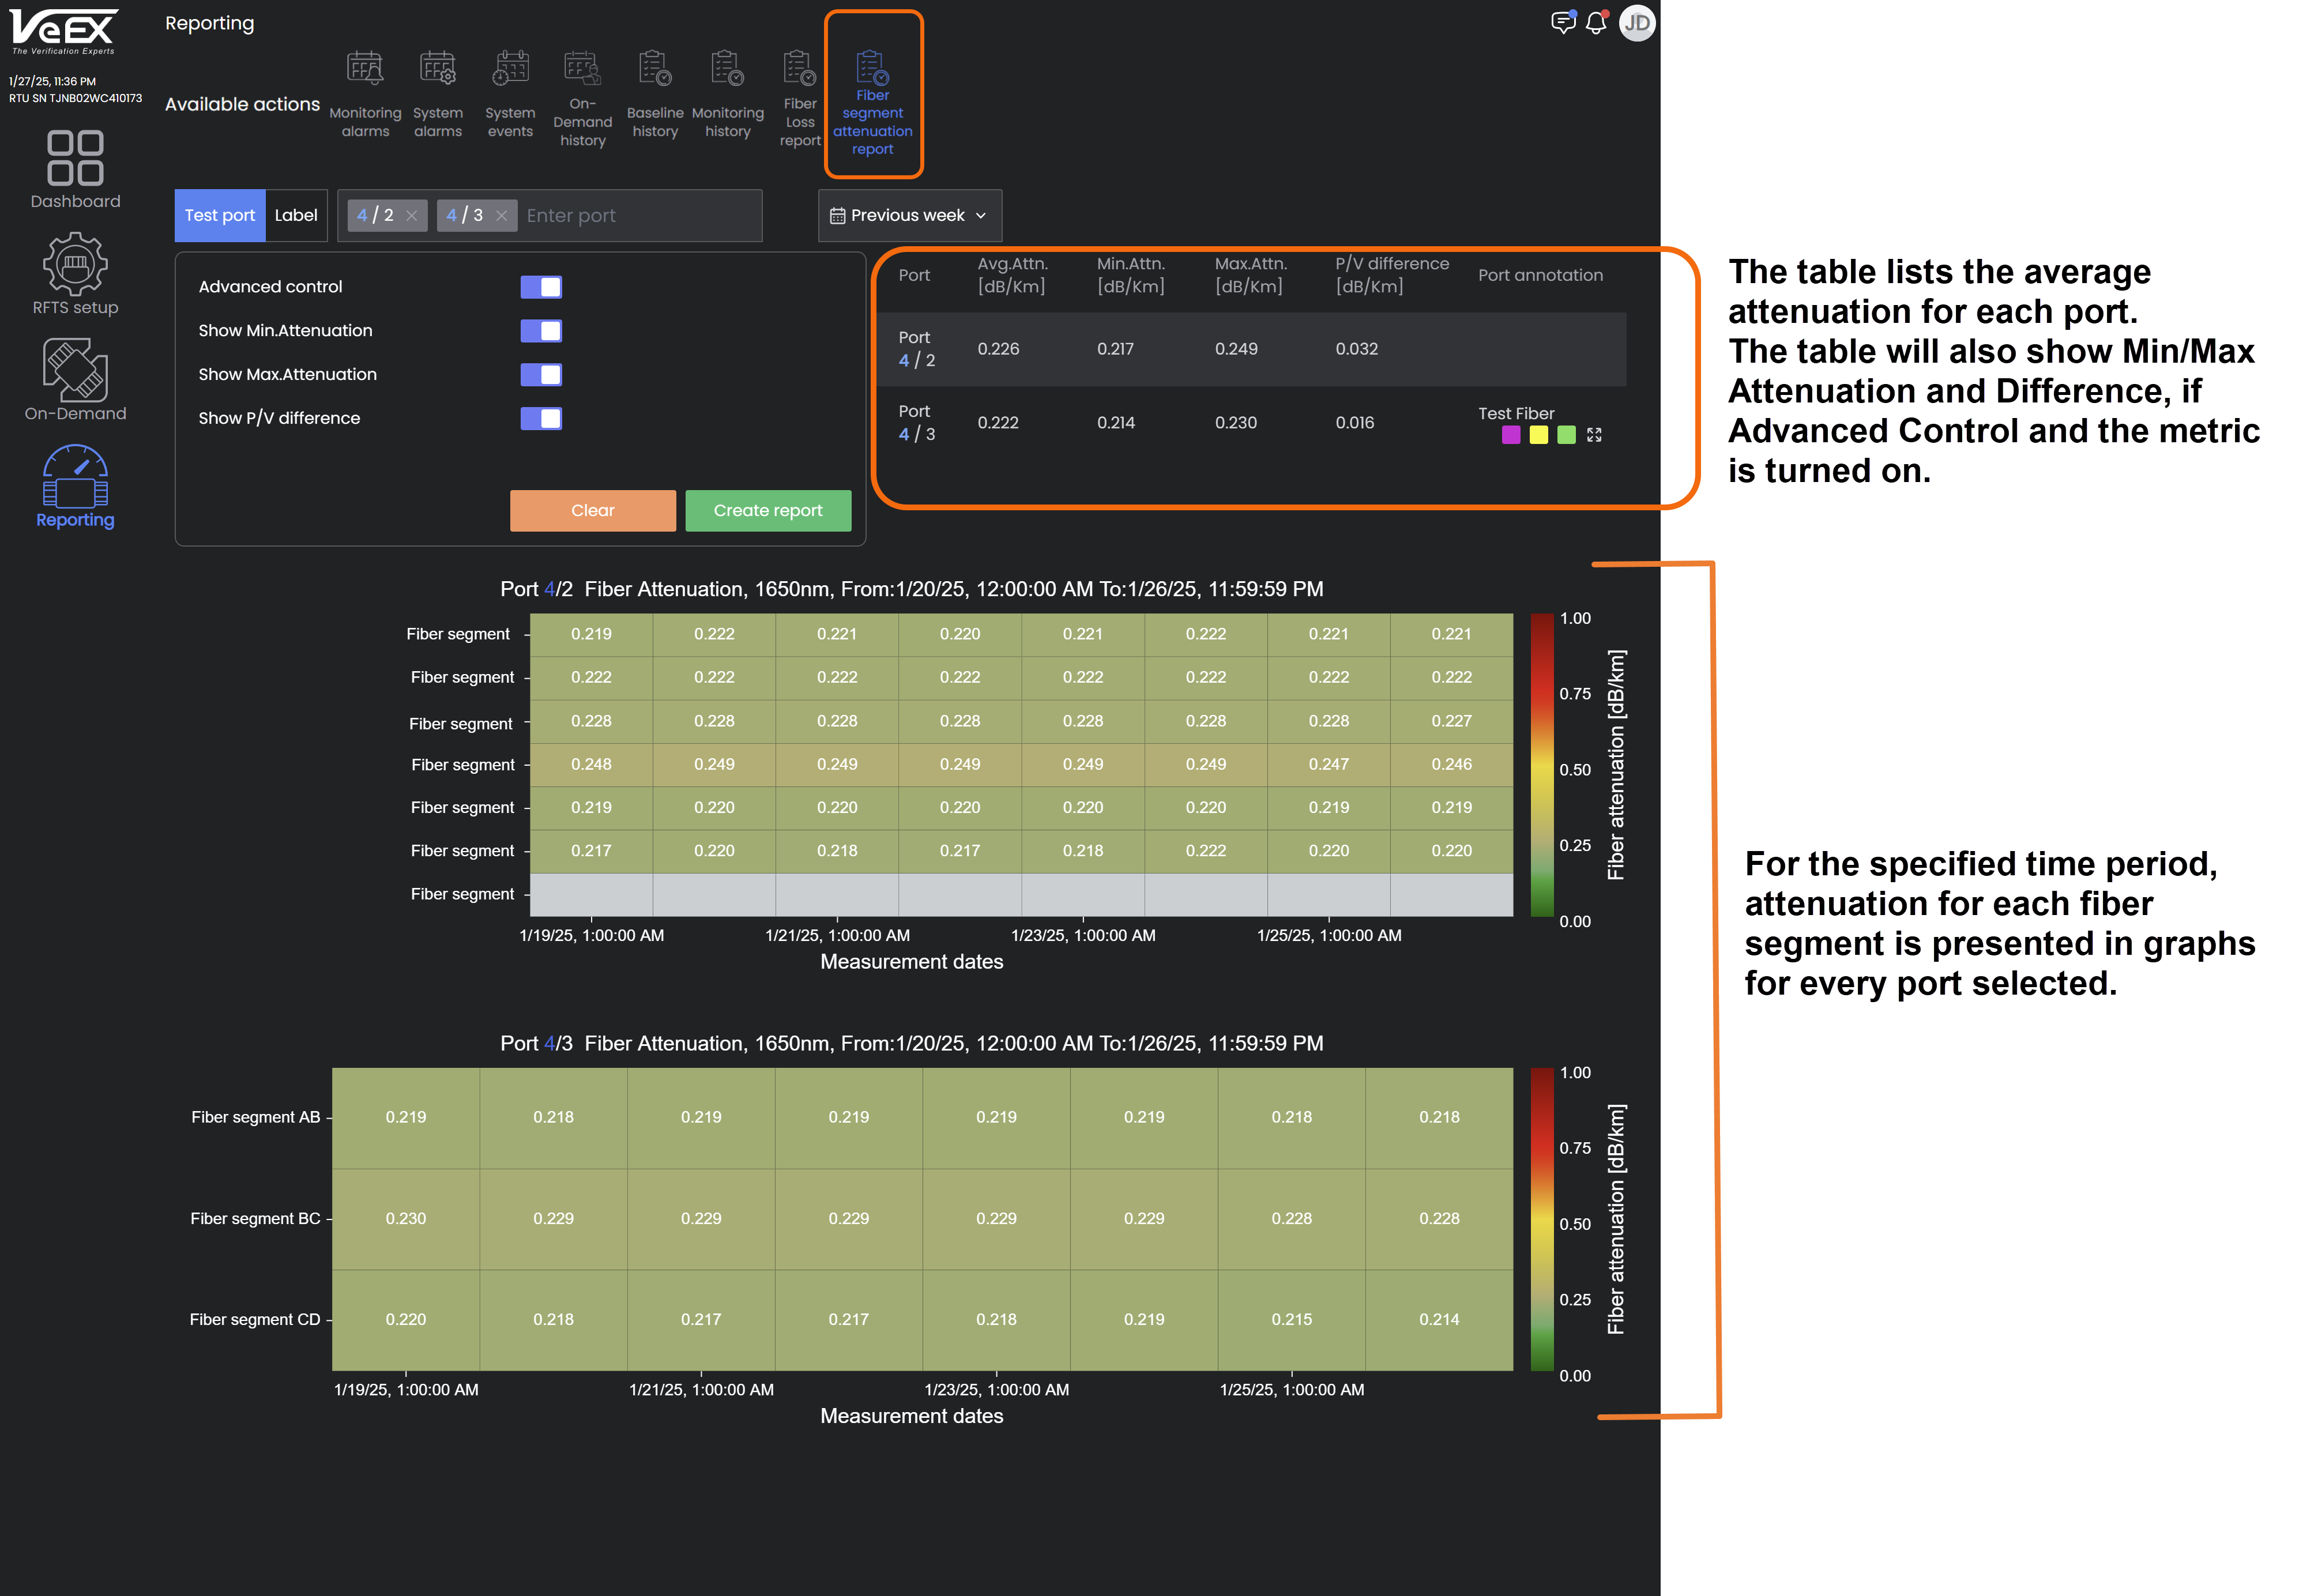
Fiber Segment Attenuation Report
The Fiber Segment Attenuation Report shows measured attenuation for each fiber segment on a heat map.
This report details loss for every segment of selected ports over a specified time period. The average attenuation appears at the top.
To filter items to a specific port or label, select the Enter port or Enter label search bar and choose the switch and port to see loss for it only. When multiple ports and/or labels are selected, graphs for each selected port/label will appear in sequence.
-
Advanced control: Select metrics to display on table in the top right of the screen.
-
Show Min.Attenuation: Measurements that exceed outside minimum threshold settings.
-
Show Max.Attenuation: Measurements that exceed outside maximum threshold settings.
-
Show P/V difference: Difference between minimum loss and maximum loss.
-