FX150+ OTDR Quick Guide
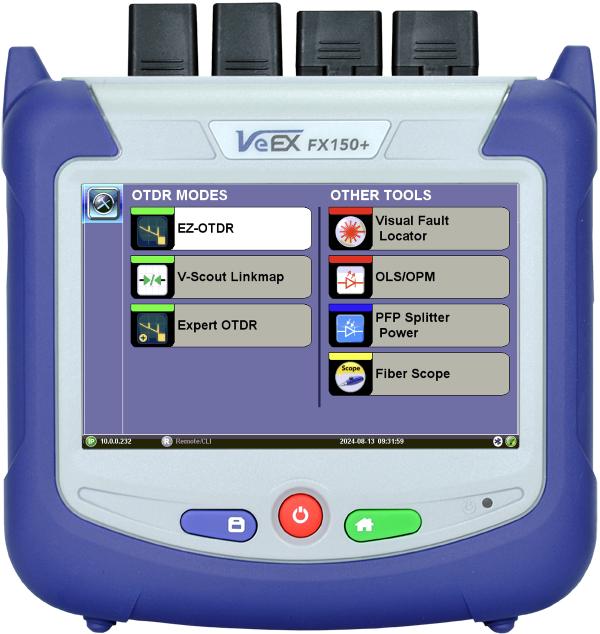
The FX150+ mini OTDR can be incorporated with power meter, light source, fiber inspection probe and VFL test options. When powered on the test set automatically loads the Fiber Applications Menu.
Step 1: Power on Test Set
Press and hold the Power button ![]() for two seconds, until a confirmation tone (beep) is heard, and the VeEX logo appears on the screen, then release the power button. The test set will take a few seconds to boot up and automatically start the Fiber Application Tools menu.
for two seconds, until a confirmation tone (beep) is heard, and the VeEX logo appears on the screen, then release the power button. The test set will take a few seconds to boot up and automatically start the Fiber Application Tools menu.
![]() To turn the test set OFF, press and hold the Power button
To turn the test set OFF, press and hold the Power button ![]() until two confirmation tones (beeps) are heard.
until two confirmation tones (beeps) are heard.
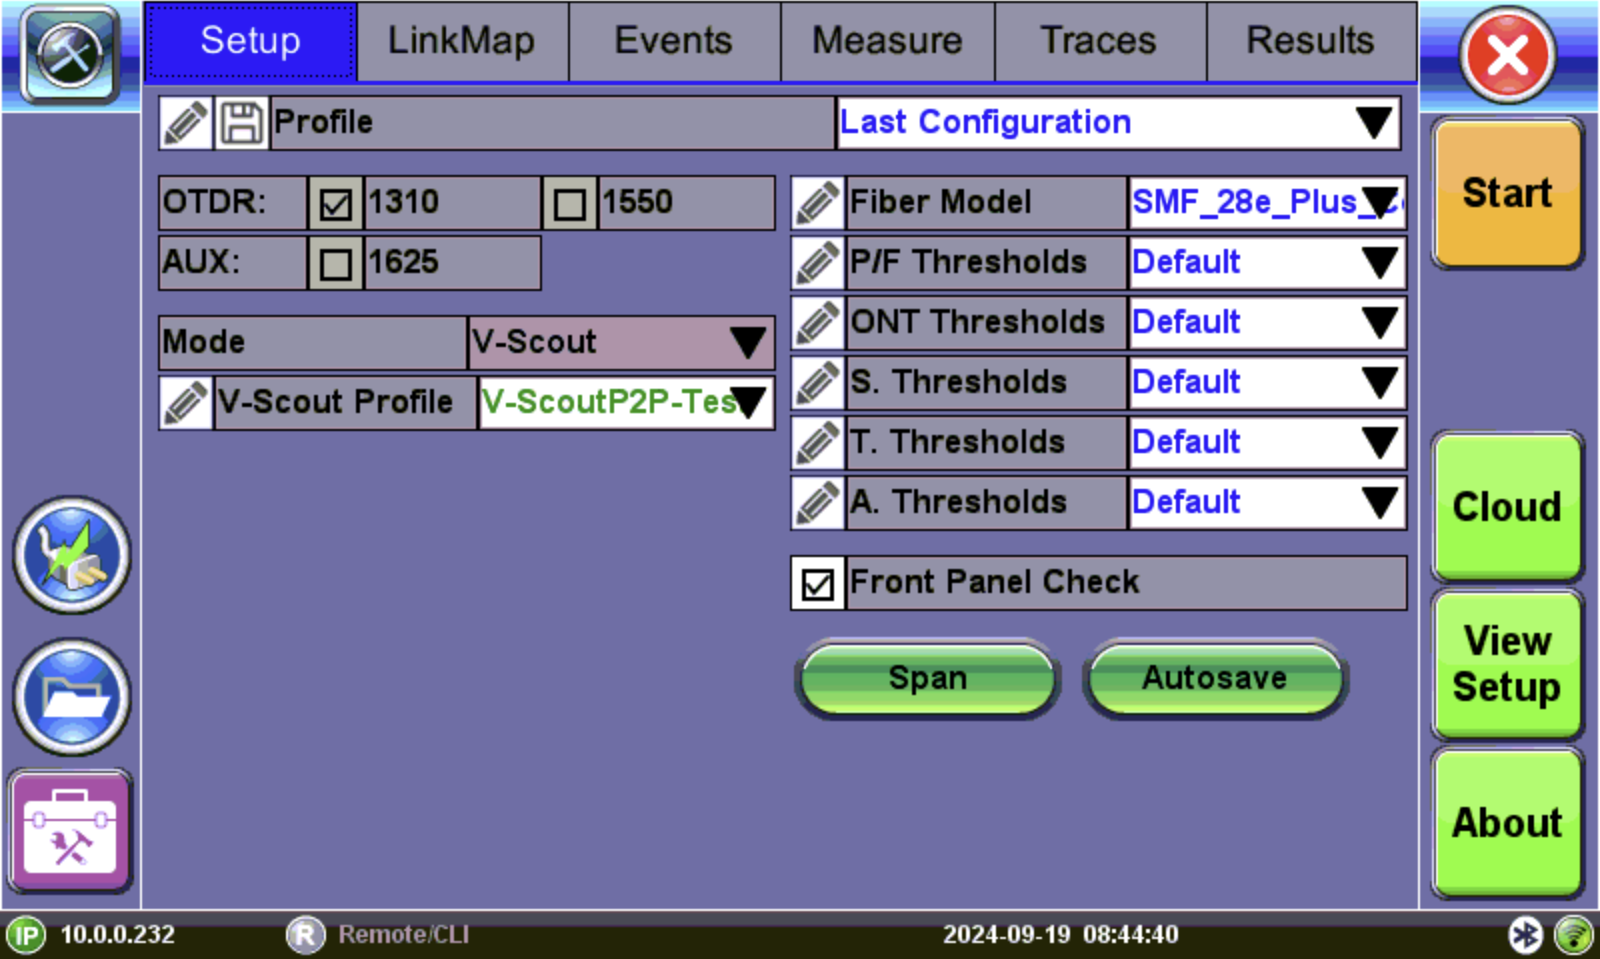
Step 2: Configure Test Profile
On the main menu, select the OTDR option:
-
EZ-OTDR: Performs a measurement and analysis of the fiber and determines optimal test settings automatically.
-
Expert OTDR: Allows customization of setups and/or manually overrides the default options.
-
V-Scout Link map: Uses factory or user defined multi-pulse test profiles with summary results displayed on a link map.
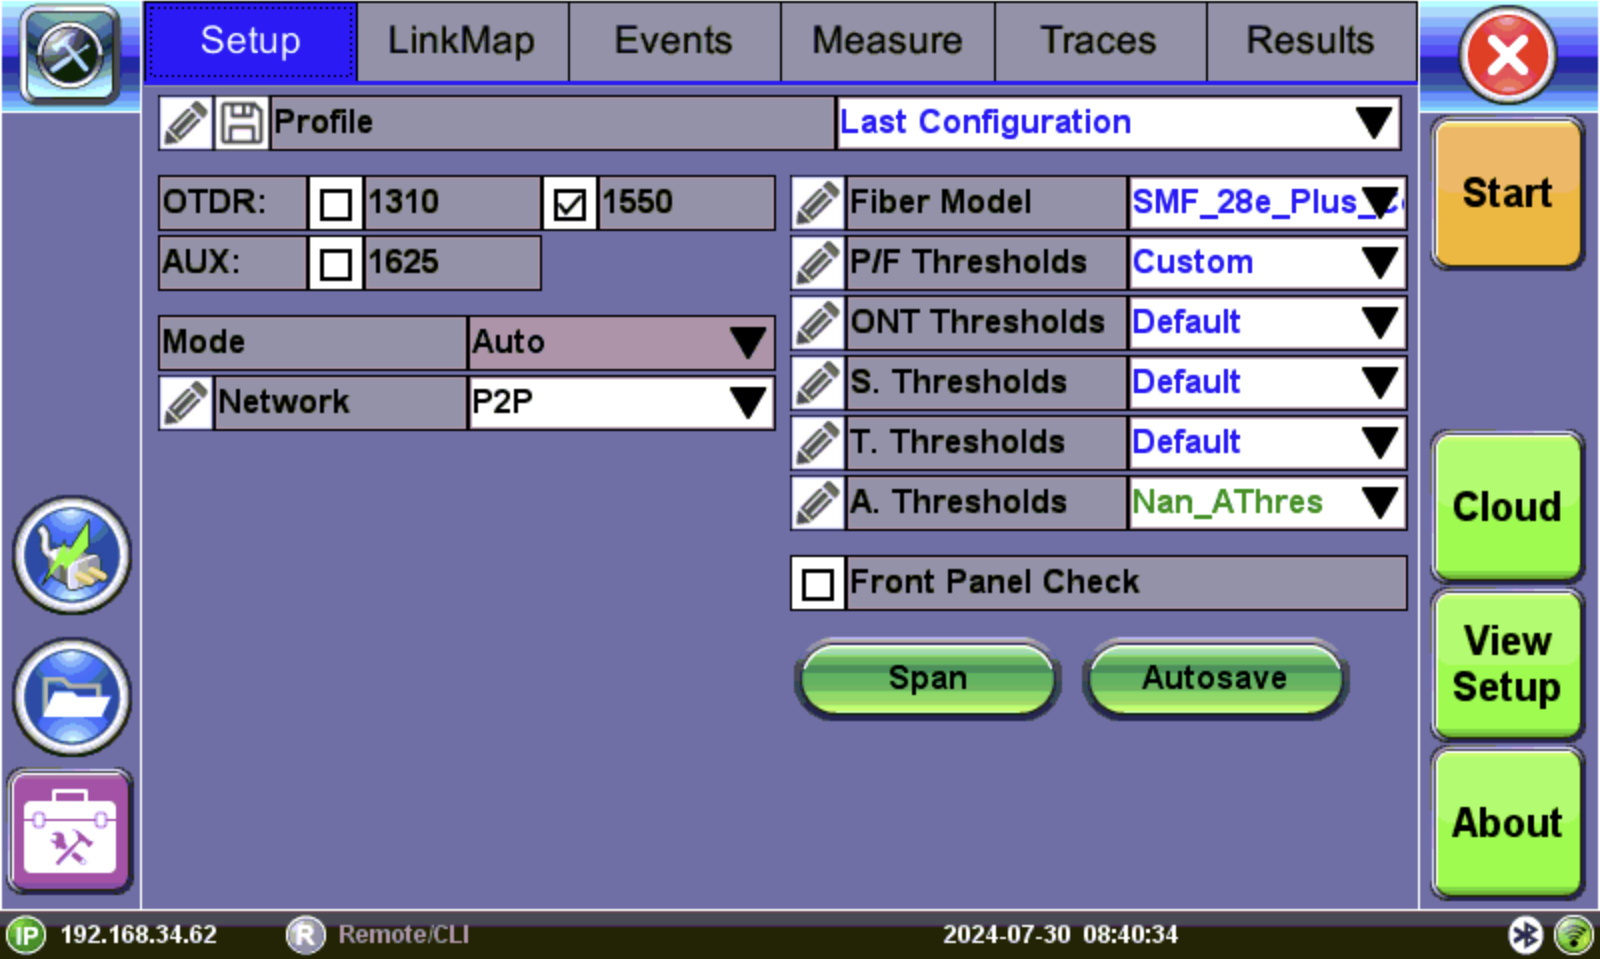
EZ-OTDR (auto mode)
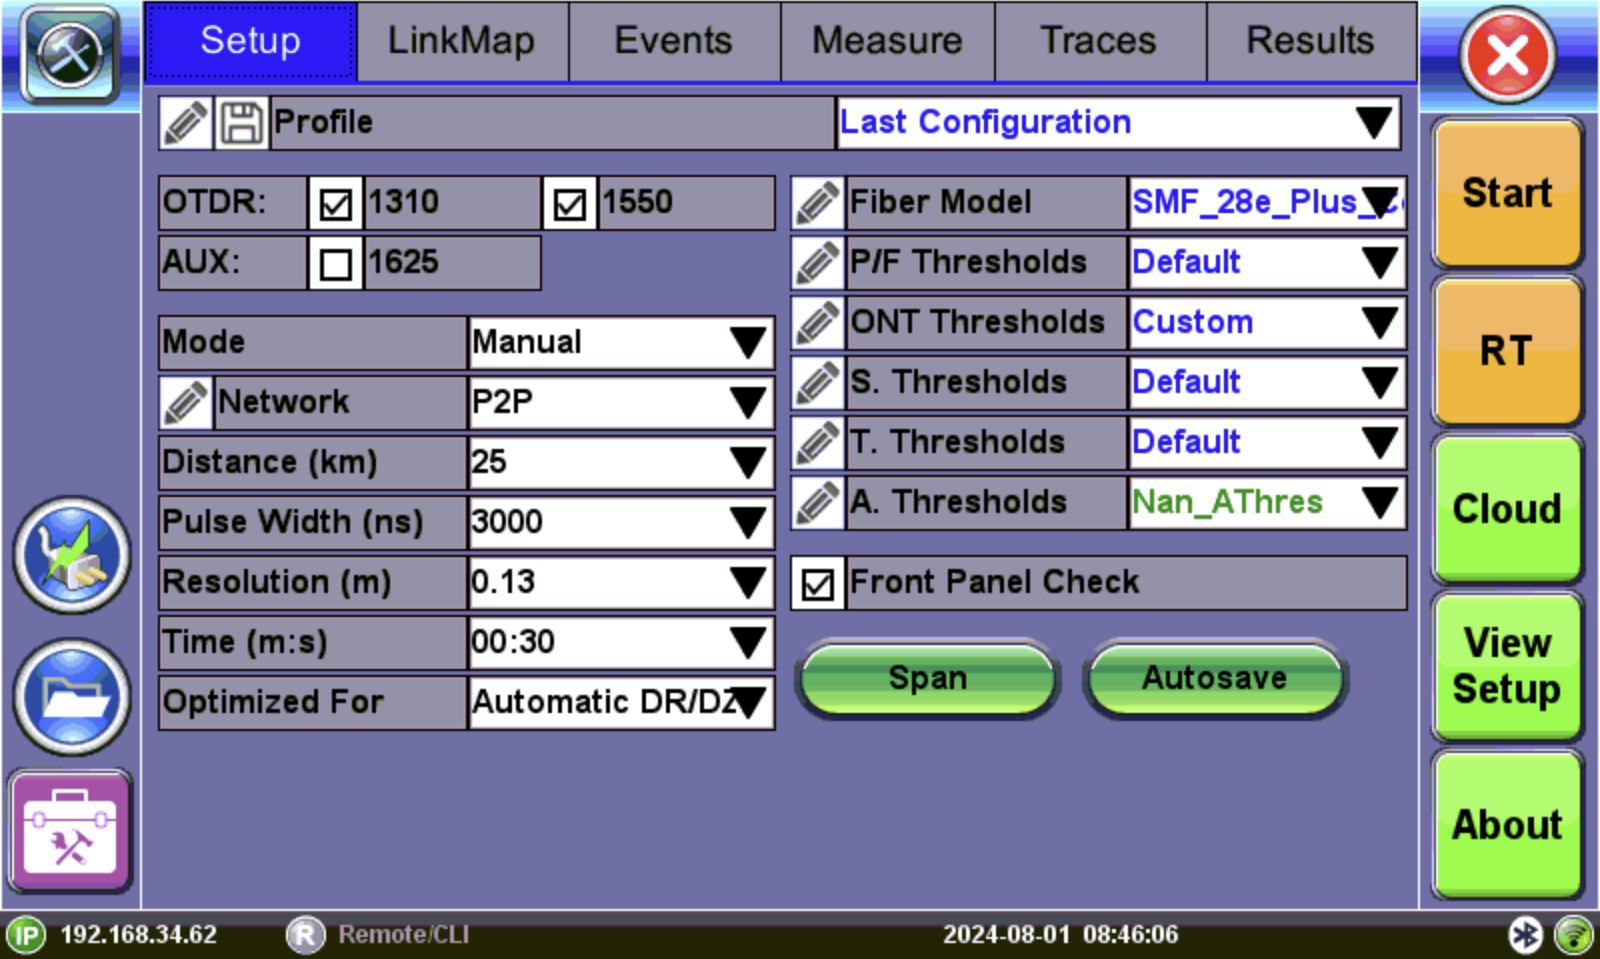
Expert OTDR (manual mode)
V-Scout Link map (multi-pulse test mode)
Select the test wavelength (SM1310, SM1550, SM1625 or MM 850, MM 1300), network type, fiber model, and thresholds. For manual mode, choose the additional options for distance, pulse width, resolution, and time.
Auto mode is intended for inexperienced operators and uses single pulse per wavelength. The type of network to be tested must be specified.
Fiber model settings apply only to the next measurement. To change refractive index (RI) and backscatter coefficient (BC) for a previously measured fiber trace, use the Information button on the Traces tab.
Use the Refractive Index (IoR) and Backscatter coefficient as provided by the cable or fiber manufacturer. An incorrect IOR can affect measured length results. Incorrect IoR and Backscatter values can affect Reflectance and ORL results.
Thresholds define the threshold values that match test requirements. Choose the default values or Custom to create a new profile with custom settings. Events will be placed into the table only if the threshold is met/exceeded. Events that fail to meet the pass/threshold will be flagged and highlighted as red in the event table.
Front Panel Check tests connection and displays warning indicating when the launch level is 1.5 dB lower than expected or if initial reflectance is too high (-35dB is default fail threshold). If needed, stop and clean connectors, or proceed with the bad connection. For OTDR with built-in internal launch fiber, (G.657), the OTDR connector insertion loss will depend on the fiber type connected to the test set. Use the Span button to enter fiber mismatch compensation or de-select Include Event Loss in the Span settings.
Autosave saves results automatically with default information in the filename, such as Job, Cable, and Fiber IDs, and with settings to increment the trace or fiber, as needed. It can also set additional information in the test file, like the node, account, location, and technician.
Cloud settings contain Fiberizer Cloud information, so test results and files can be pushed to the Cloud account.
View Setup settings contain trace display options such as units, 3rd party save format, RealTime button on menu, grid color, etc.
Step 3: Connect Patch Cord to Test Port
Inspect and clean the test ports and patch cord connectors. Then, connect the patch cord to the main OTDR test port. This is the main OTDR and secondary OTDR PON-capable OTDR port. Selectable single-mode (1310, 1490, 1550 nm wavelengths) or multimode wavelengths. (41dB dynamic range is recommended to support PON with up to two splitters with 1x128 splits total.)
|
|
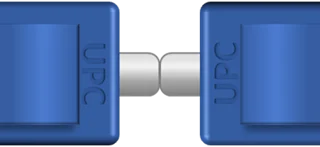
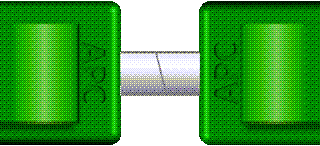
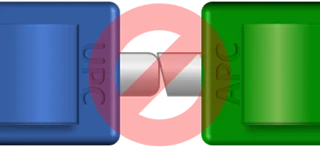
Before Connecting: Know the difference between APC and UPC connectors.
Angled Physical Contact (green body) connectors' end faces are polished at an 8º angle, while Ultra Physical Contact (blue body) connectors are polished flat. They are not compatible.
If the connector on the device, patch panel or fiber is green, has a green base, dot or marking next to it, it indicates it is an APC connector and requires the use of matching APC test cords. The use of APC connectors is common in modern OTDRs due to their lower optical return loss.
For more information, including video instructions on inspecting a connector end-face, go to "CLIC" - Clean to Maintain Optical Connector Quality.
Step 4: Run Test
-
Tap the Start button
 and the Measure tab screen appears. The measurement will begin according to the test parameters entered in the Setup menu. (See Setup Screen.) Elapsed time is indicated below the Stop button
  .
.
If multiple wavelengths are selected in the Setup menu, the measurement will be performed using all selected wavelengths one after another without stopping and will be overlaid on the screen for comparison and review. V-Scout multi-pulse traces are also overlaid and displayed automatically.
-
When the test is complete, the Stop button will revert back to a Start button. If needed, tap Stop to terminate the measurement manually.
-
If Autosave is enabled with Ask Before Save checked in the Autosave Parameters screen, a Result AutoSaving window appears asking if the results should be saved. If Ask Before Save was not checked, results will be saved automatically using the filenaming parameters previously set for AutoSave.
-
Tap OK to autosave with the default settings. Tap Abort to exit the screen.
-
When the test plan is complete and OTDR traces performed, view the link map on the Link map tab.
Events
The analysis results are trace events. They are marked on the trace with the marks showing the event types (![]() for fiber beginning,
for fiber beginning, ![]() for splice loss,
for splice loss, ![]() for fiber end, etc.) Full event details are provided in the event table on the bottom, the span beginning and end are marked with brackets (see below).
for fiber end, etc.) Full event details are provided in the event table on the bottom, the span beginning and end are marked with brackets (see below).
Link map
The link map view presents a simplified view of measurement results by analyzing all the event table results for each pulse, whether using single or multiple pulse widths, and all test wavelengths. A span summary is displayed, in the form of a block diagram, for each test wavelength shown at the bottom of viewing window.
Select an icon to obtain more information about that specific event on the fiber
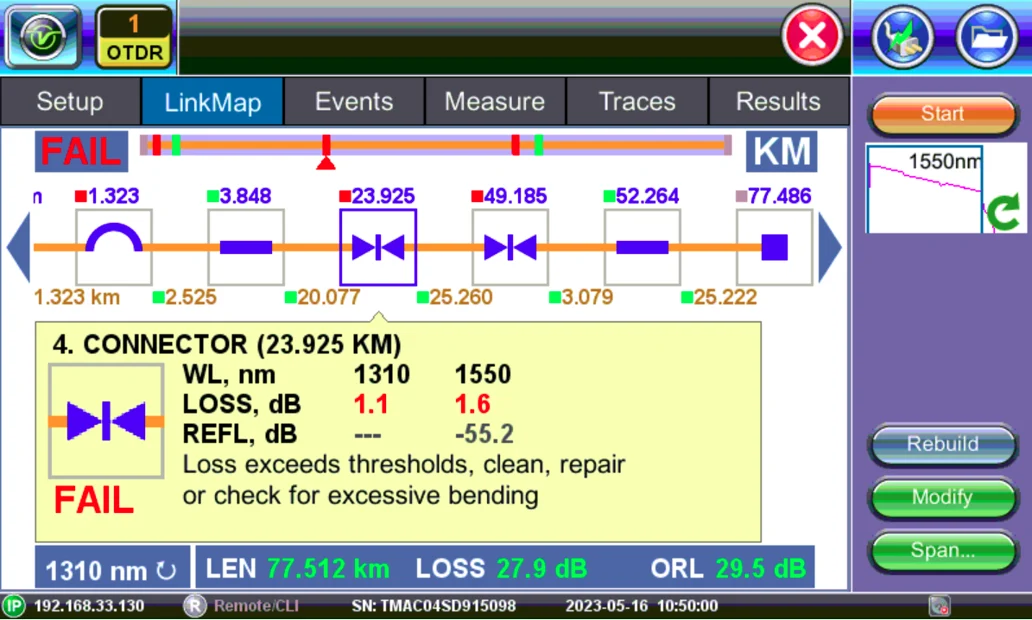
Link map showing splice with excessive loss
|
|
The link visibility can be significantly improved by using multiple pulse widths to provide better event details. |
Traces
After running a test, select the Traces tab to view the active or measured OTDR traces. The color-coded blocks represent the corresponding trace viewed in the OTDR display. The OTDR can display up to ten traces simultaneously (i.e., an active trace and nine additional traces).
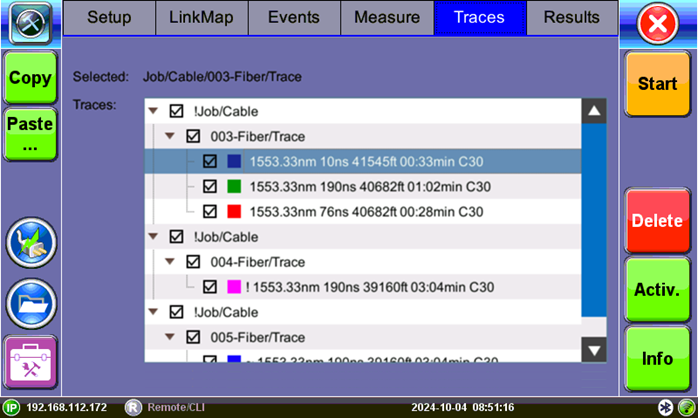
Traces tab
Traces are displayed along with the name, pulse width, distance range (LMax), and acquisition time used for the test. To view any trace, select the file(s) using the check box. All selected traces will be overlaid and can be viewed using the Results/Traces tabs.
Results
The Results tab is used to view previously saved OTDR test results. OTDR traces can also be manually saved using the Results tab.
The traces are saved in the following folder directory hierarchy:
- Job ID
- Cable ID
- Fiber ID
- Results – Traces
To manually save Traces:
- On the Results tab, select the trace you want to save.
- Click Save, then click Save. On the Result Saving window, change default information on the tabs as needed and enter filename in the Traces ID field, and then click Save.
To view or print reports, use the File Management feature or one of the Fiberizer software applications. Refer to File Manager.
Step 5: View Test Report
Test reports can be accessed from the test set's files or from a mobile device by scanning a provided QR code. Refer to File Manager in the User Manual for more information on accessing the test set's files. For more information on viewing reports on mobile devices, refer to Working with Saved Results, Profiles, Images.
View Test Report from Platform Files
To access the test results stored in the test set:
-
Select
-
Select the desired results file to open the test report.
To navigate the test results report, use the links in its Table of Contents and the
NoApp®: View Test Reports on Mobile Device via QR Code
To view OTDR Test Reports on a mobile device, turn on the setting in the test set's platform settings.
Go to ![]() > System Utilities > Global Settings > Storage Settings and make sure QR Code Generation is turned ON.
> System Utilities > Global Settings > Storage Settings and make sure QR Code Generation is turned ON.
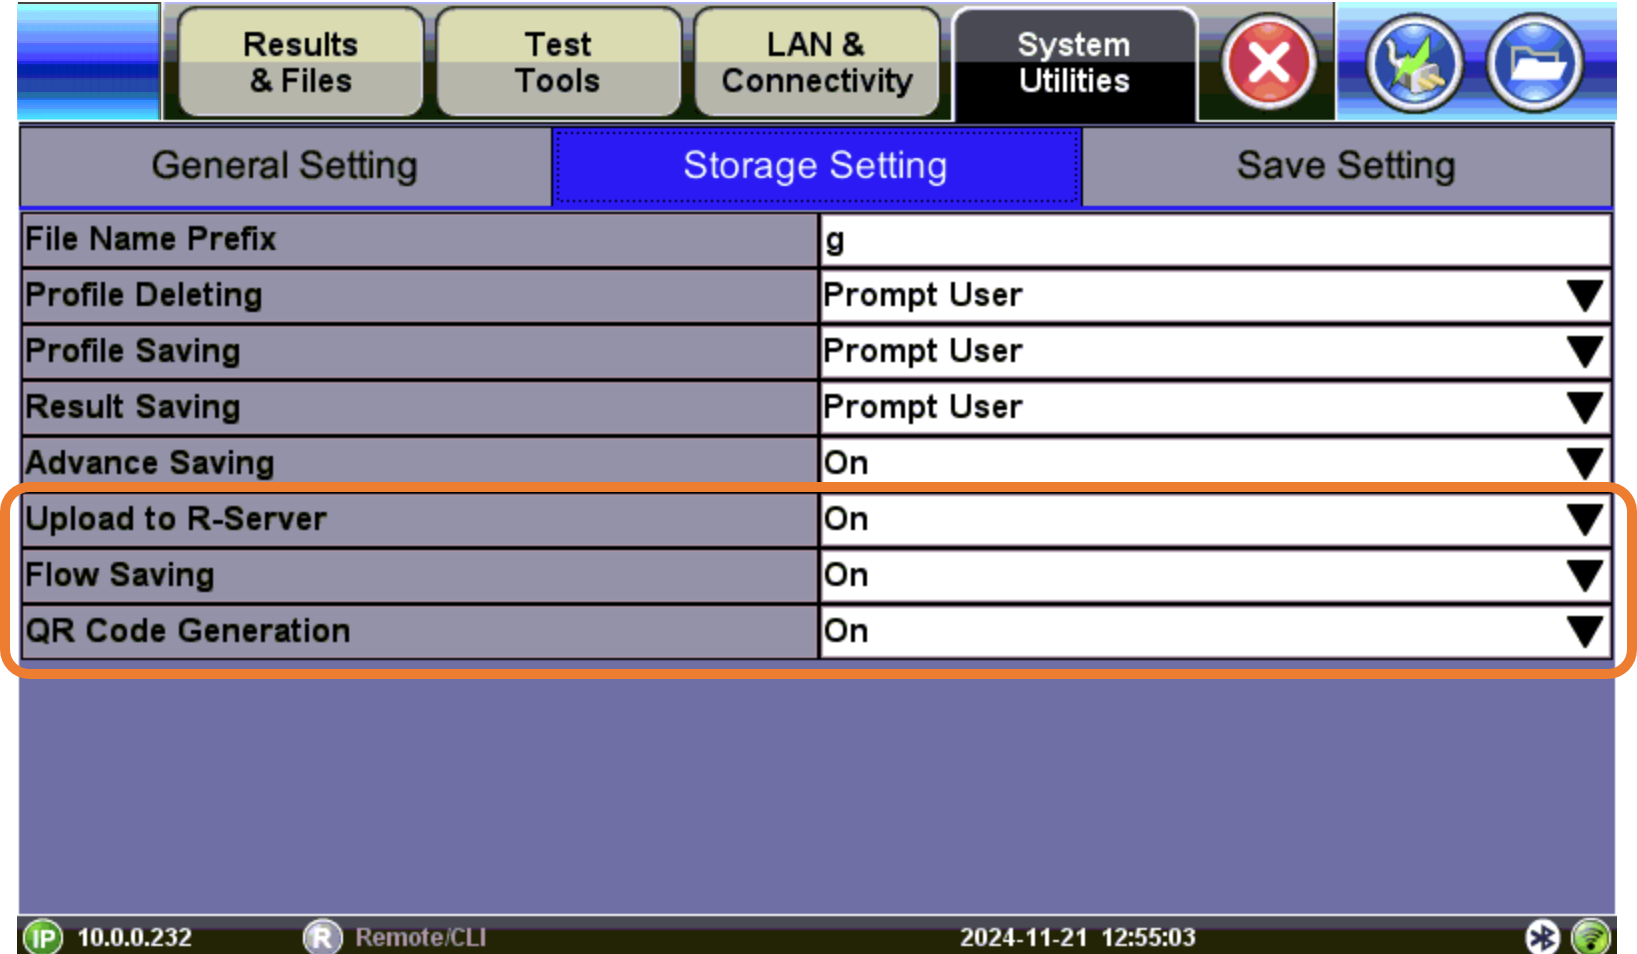
Enable QR Code Generation
VeEX's NoApp® (US Patent 12,190,199)![]() cloud service enables basic meters and advanced test sets to quickly and easily transfer test results' KPI to a phone or tablet, to instantly generate test reports and allow sharing and uploading to centralized R-Server or cloud. See short video about the VeEX NoApp® Wireless Test Results Transfer via NFC.
cloud service enables basic meters and advanced test sets to quickly and easily transfer test results' KPI to a phone or tablet, to instantly generate test reports and allow sharing and uploading to centralized R-Server or cloud. See short video about the VeEX NoApp® Wireless Test Results Transfer via NFC.
![]() Internet connectivity is required (e.g., Wi-Fi, LTE, 5G, etc.).
Internet connectivity is required (e.g., Wi-Fi, LTE, 5G, etc.).
Immediately after saving results, a screen with a QR code appears. To view the test report via mobile device, scan the QR code with the mobile device’s camera. Tap OK to exit the screen on the test set.
Alternatively, tap the QR code icon ![]() on the File Manager screen.
on the File Manager screen.
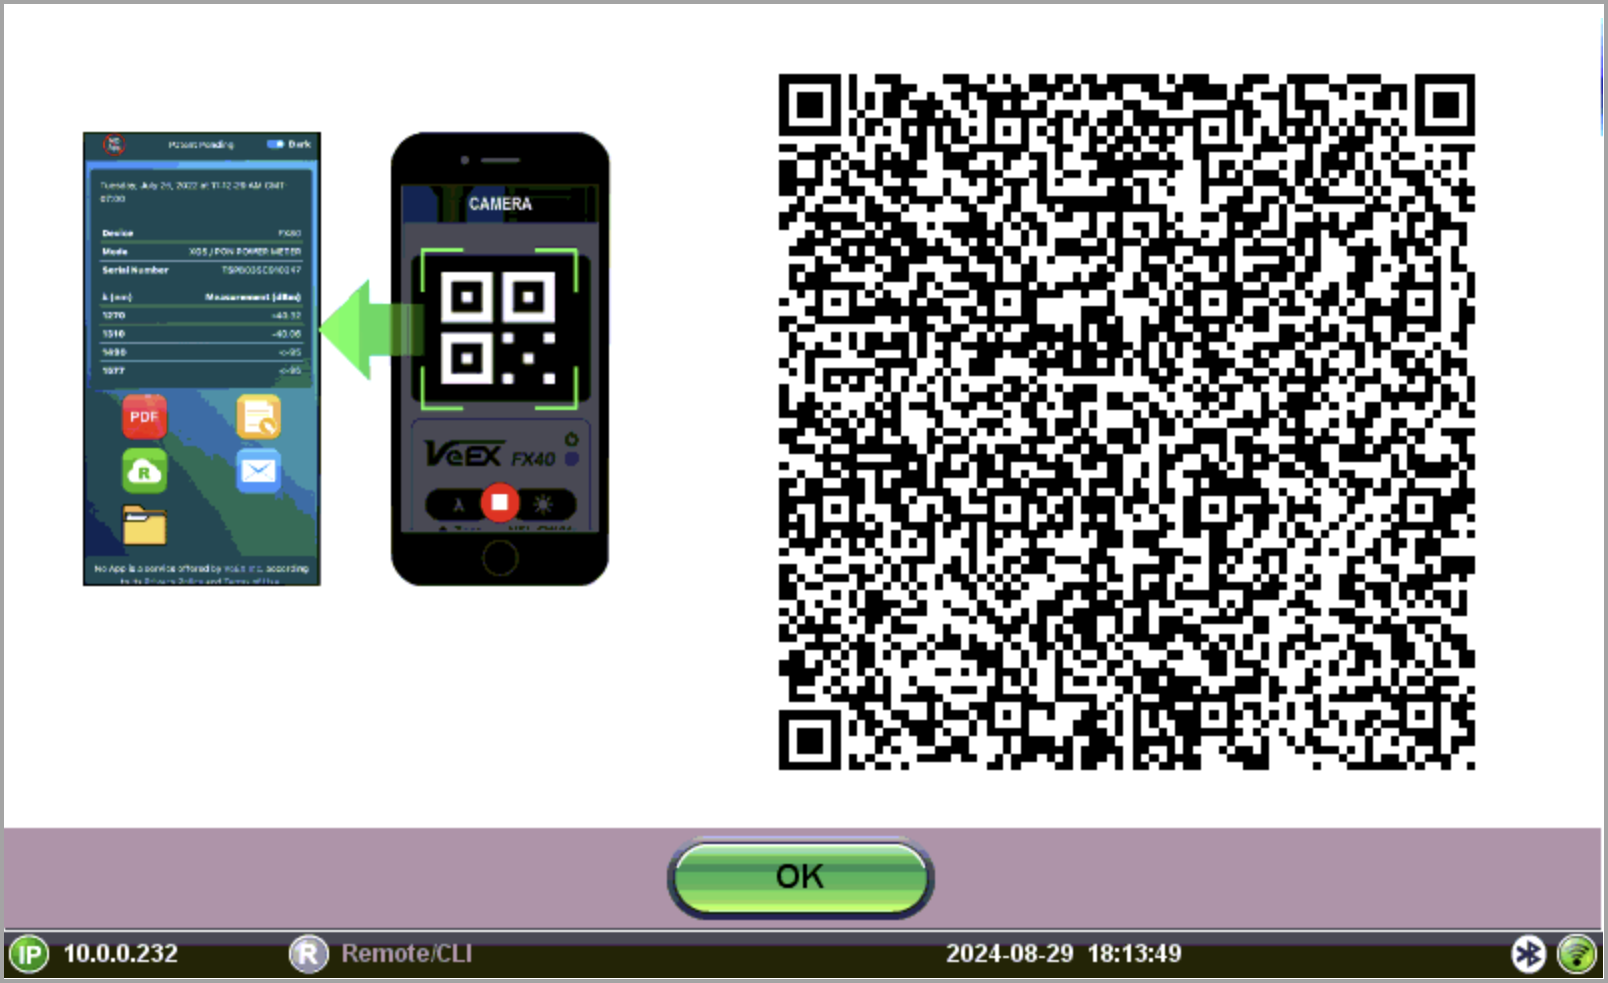
Test Report QR Screen
After transferring results to a mobile device via the QR reader, the browser launches automatically and displays them.
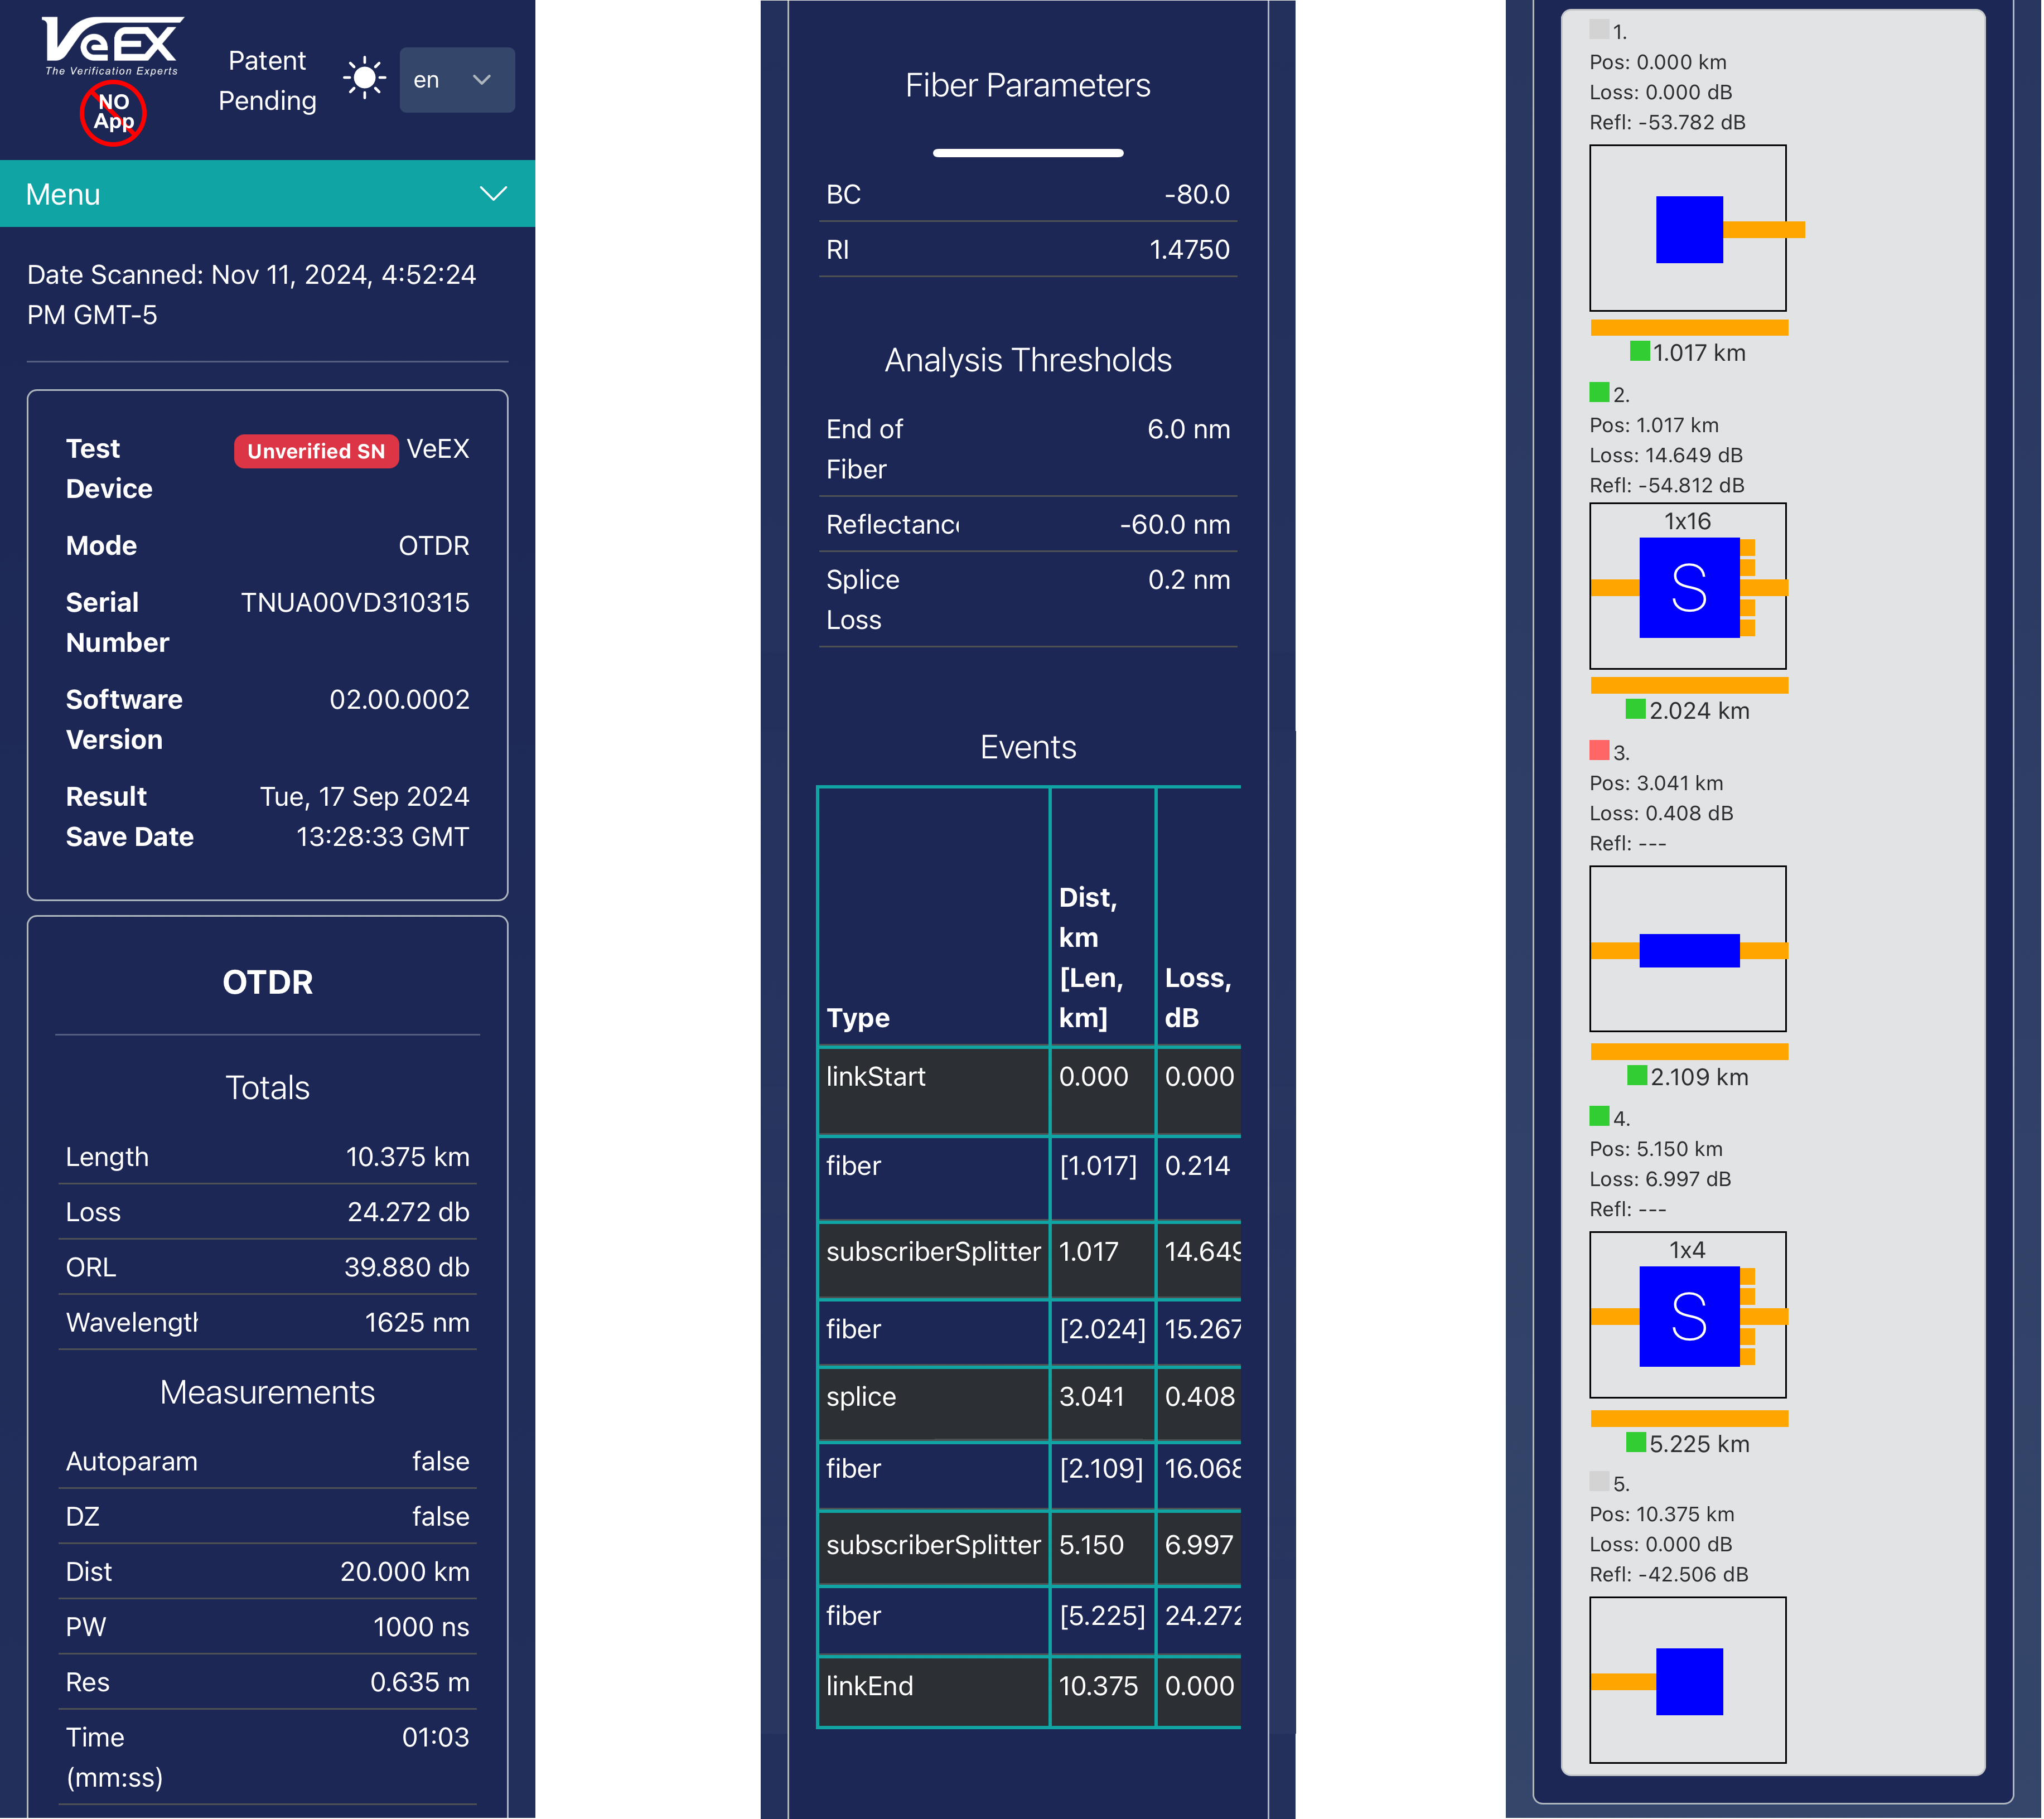
The top of the screen shows the device type, mode, serial number, and software version, and the date results were saved on the device.
Export options appear at the bottom on the screen. Alternatively, tap the Menu drop-down menu to view the options.

Results - Mobile View Export Options
|
|
Adds/Removes location (GPS coordinates) from results report; customize report with logo. |
|
|
Generates complete report in PDF format, which can be shared with the customer (subscriber) or emailed to a supervisor. |
|
|
Exports to JSON format, for third-party integration or processing. |
|
|
Adds extra job-related information to the report (e.g., Job ID, tech's information, comments, pictures, etc.). |
|
|
Uploads results to R-Server (for R-Server users). |
|
|
Texts results via SMS protocol. |
|
|
Emails current test report. |
|
|
Creates a new project for results so multiple test results, from the same or different test sets, can be combined into a single job report. |
|
|
Opens knowledge base. |
|
|
Opens documentation resources for test set. |
Other Test Features
![]() PROTECT YOUR EYES!
PROTECT YOUR EYES!
Never look directly into the optical test ports and VFL's light. It is a Class II laser and emits laser radiation that can potentially harm your eyes with extended exposure. It is good practice to never look directly into any fiber connector for any reason.
Fiberscope
The Fiberscope test application can be used in conjunction with any VeEX Digital Fiber Inspection Microscope.
It presents a real-time view of the connector’s end face allowing for alignment and focus. The capture screen displays a live image of the connector face and features analysis and freeze tools.
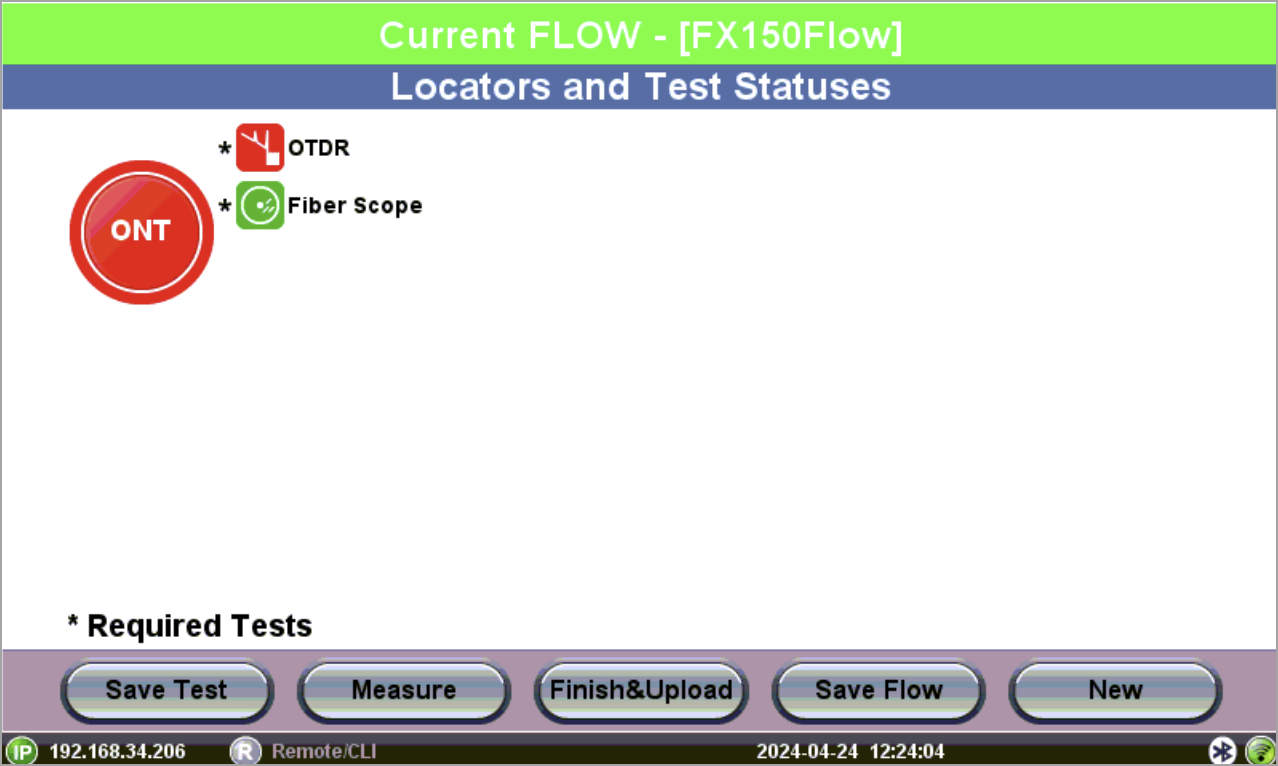
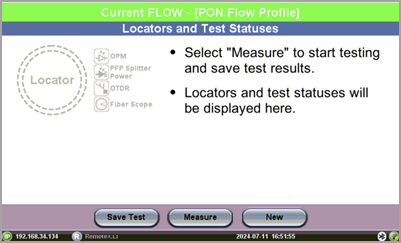
FLOW®
Use the Flow® Toolbox application to save a series of tests and compile them into a full Flow® Test Report. Create a basic Flow® job test profile to guide workforce with making multiple tests. Implementation of Flow® allows technicians to use multiple test tools to build and properly certify various fiber networks by applying Pass/Fail indicators into a consolidated Job test report. Flow® supports multiple test applications.
If the test set is registered with R-Server, the R-Server controls whether Flow® profiles can be created using the test set. When allowed by R-Server, the test set's Flow® application includes a Default profile. The Default profile can then be used to dynamically create and test Locators without the need of an R-Server defined Flow® profile.
![]() If R-Server does not allow the test set to create profiles, the only profiles available for selection will be R-Server defined Flow® profiles.
If R-Server does not allow the test set to create profiles, the only profiles available for selection will be R-Server defined Flow® profiles.
OLS/OPM
The unit can be equipped with an optional Optical Light Source (OLS) to use in conjunction with any OPM to measure link loss. The OLS radiates continuously or in pulses with modulation.
It can also be equipped with an optional built-in Optical Power Meter (OPM). It can also access an external Optical Power Meter using the Micro-USB port. The OPM tests output power from a fiber and can be used to measure the span loss of optical fiber systems in real-time.
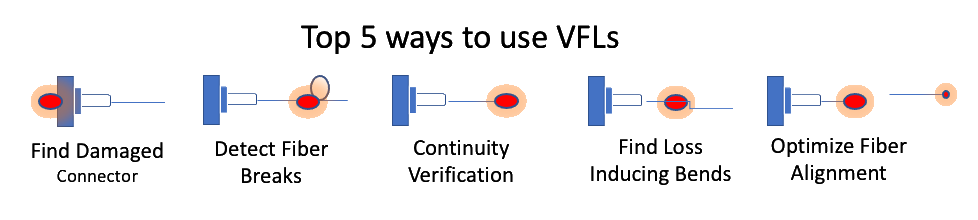
Visual Fault Locator
The unit is equipped with an optionally built-in Visual Fault Locator (VFL) to trace and visually identify breaks in ODFs, bare fibers (900 µm), and patch cords that are typically hidden in the OTDR dead zone.
The VFL works by injecting a 650nm visual red light into the fiber (up to 5 kilometers/3 miles) to bend a single fiber strand and force light to exit the center of the fiber. It traces it to identify faults through light leakage. It identifies fiber strands, connectors, breaks, bends and other potential problems or anomalies on events.
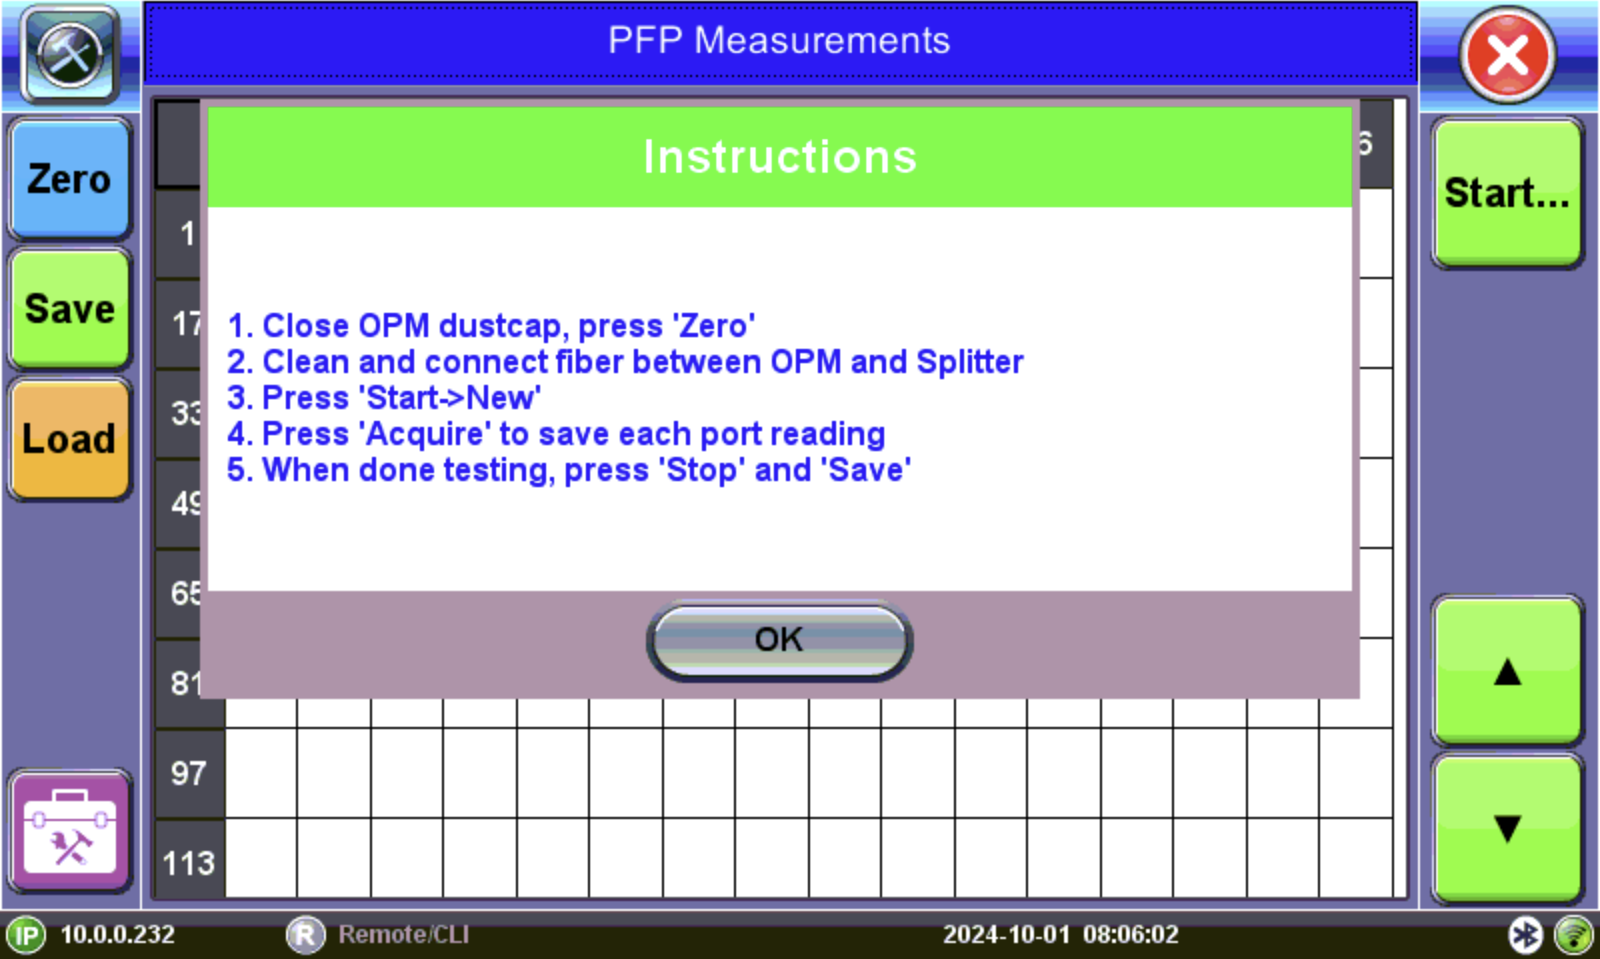
PFP Splitter
The PFP Splitter Power analysis provides a way to measure insertion loss for every fiber strand in sequence and readings saved and loaded later, if needed. The process is secured with a graphical display, limiting the risk of errors.